Apparent Dip is thrilled and profoundly happy to announce that my endorsement of Barack Obama for president appears to have worked, tipping the balance in crucial states, and leading to an overwhelming victory for Barack Obama.
I am unfortunately listening to television pundits try to sound profound right now. John McCain gave a fantastic concession speech, I am glad he did not speak like that during the campaign, I feel the contest would have been much closer.
Time to watch his acceptance speech!
Showing posts with label impending thermochronocracy. Show all posts
Showing posts with label impending thermochronocracy. Show all posts
Tuesday, November 04, 2008


Sunday, November 02, 2008
Thermochronologists for Obama
 The wait is over. All across the country, undecided voters have been waiting by their televisions, constantly checking email, listening non-stop to NPR, just to learn which presidential candidate has earned the Apparent Dip seal of approval. I know how much sway my choice has, believe me, as the author of the world's leading thermochronology themed blog...well, let's just say the responsibility has weighed heavily on my (figurative) shoulders.
Apparent Dip is officially endorsing the Obama/Biden ticket. No big surprise perhaps. As someone who reads books, did well in school, and grew up in California, I obviously don't belong to the "real America" I've heard so much about at GOP rallies. I grew up in a decent sized city, which means I lack "small town values" and therefore hate my neighbors, can't stand families, am allergic to hard work, do nothing worthwhile, am a communist, cavort with terrorists, and of course, want America to fail. I am also an elitist because I think issues are complicated and can't always be summed up as one-liners, oh, and I also enjoy reading and non-motorized outdoor activities, which means I am a whiny liberal tree-hugger. Oh, and I don't believe that the term "mothers health" should be put in air quotes or muttered in a snide tone. I care a great deal about my mother's health, and don't consider that an extreme position.
On the issues, well, this seems to be a no brainer. I can't think of a single thing that has gone well in the Bush administration, and McCain agreed with Bush 90% of the time. Right now, the university I work at has a football team that has had a rough few years. Really rough, no bowl games, no winning seasons, no big crowds, embarrassing losses, you know what I mean. Much of the blame is laid at the feet of the coach. Would a fan of this team want to replace the coach with someone who thought he did 90% of everything right? Of course not.
Add to this the fact that for the first time in my life, I have been inspired by a politician. Now, I don't agree with everything Obama is proposing, and I understand the realities of politics, I know many of his plans will be difficult to enact. They always are. What gives me hope though, is that Obama recognizes and acknowledges that issues are complicated. Obama has even spoken about what a huge problem anti-intellectualism is in America today. Seriously, a politician who isn't pretending to be a doofus. A politician who thinks it is important to be more than a guy "you can have a beer with." You know what guys who you can have a beer with are good for? Having a beer with.
On a serious thermochronology note, McCain and Palin have both made offensively ignorant and anti-scientific statements recently. They both love to rail against government spending on research, even when it is obvious that they have no idea what the research is really for. Remember Palin's rant about fruit fly funding? I'm no geneticist, but anyone who has stayed awake through a college biology course knows the importance of fruit flies in genetics research. And guess what, the research Palin was slamming actually is involved with treating children's autism. In one of the debates, McCain brought up DNA research on grizzly bears as a waste of money. Turns out that is the most effective way to understand their population and therefore enforce the endangered species act. But hey, who cares? This also came up a few years ago, when I heard McCain ranting about funding to study "cow farts." The research was actually about methane, a potent greenhouse gas, much of which happens to come from cows. But hey, as long as you can reduce serious science down to a funny one-liner, it must be a waste of money. Not a good use of funds like the Iraq war. To be fair, I don't expect McCain and Palin to know all the science. I do, however, expect them to consult with scientists on scientific issues, which from their statements they apparently do not. And to boot, Palin is a proponent of teaching creationism (excuse me, I mean incompetent design) in public schools, a sure fire way to undermine science. If someone wanted to destroy America's ability to compete scientifically in the future I believe they'd favor the same programs.
I could go on, and it would become more rantish. Long story short, the world's leading thermochronology blog is officially endorsing the Obama/Biden ticket for the 2008 presidential election. I care too much about the future of the country, despite my status as a fake american elitist. Don't forget to vote!
Monday, October 20, 2008
FT2008 - Alaska chapter 4 and a big thanks

Before I write any more about FT2008, the International Conference on Thermochronometry, I need to take care of one blog related item. Last week I was named a "blog of note" on blogger.com, and have since seen a drastic increase in my readership. Above is a bar graph of my daily page loads from 10/10/2008 until today. Take the statistics challenge, see if you can tell what day I was named a blog of note. I removed the actual numbers, well, mainly because I have been shamed into realizing I was letting my blog suffer tremendously and therefore are unwilling to admit my average readership. But, thanks to the recognition, my page loads really spiked, that first day they were 2 orders of magnitude higher than average, and although they have settled down, are still 20 times what I am used to. Now, based on the comments, many people want to attribute this to my pretty pictures from Alaska, but that is probably only because they are embarrassed to admit how addictive thermochronology can be. I understand gentle readers, but don't be ashamed, it is OK to admit that you are fascinated by thermochronology, that you now want to quit your career and pursue this new passion, that you now try to work in the phrase "thermally activated volume diffusion" into everyday conversations, and you are constantly frustrated when reviewing papers that compare apparently phase-independent "40Ar/39 ages" to U-Pb zircon ages like they are the same thing.
Seriously though, thank you to whoever named me a blog of note, and to all of the people who've had so many nice things to say about the blog and my pictures. I appreciate the kind words.
So back to FT2008, the International Conference on Thermochronmetry. In a previous post, I discussed some of the methodoligical advancements I was most interested in. Today I just wanted to highlight a few of the case studies I found most intriguing. Again, if you are interested in these topics, make sure to check out the free and downloadable extended abstracts from the meeting, available from the Union College FT2008 website. Of course, these will be interspersed with random pictures from the field trips, in no particular order.

- There was one talk and a few posters that dealt with apatite fission-track and (U-Th)/He ages from tunnels in the alps. The talk was by Reinecker, and I apologize for not remembering his first name, and the posters were by Glotzbach and Spiegel. All of these papers were in the Alpine Orogen session on the Thursday of the talk. So why tunnels? Well, these tunnels go straight through significant topographic peaks. Isotherms, or surfaces of equal temperature in the earth, tend to mimic topography, especially at relatively shallow levels. In some ways this is a problem in thermochronology. We often would like to know how fast things came to the surface, but that depends on the depth of the closure temperature isotherm, which in turn depends on toppgraphy (and many other things), which we don't necessarily know. Isotherms are deflected up under large topographic peaks, meaning that if you drill sideways through a mountain, you will experience hotter and hotter temperatures towards the core of the mountain. So I mentioned that the deflection of isotherms is a problem for us brave thermochronologists, but used correctly, it could also be a relatively powerful tool. If topography can affect isotherms, then topography should also be recorded in thermochronometers. The tunnel studies should see evidence for the topography being recorded in the low-temperature thermochronometers. Turns out it isn't so obvious, but I'll leave the abstracts for you to read.


A Blue Grouse (I think, correct me if I am wrong)
- In the last few years there have been a number of studies investigating the link between climate and tectonics. Specifically, which drives which? My own personal belief is that it just isn't an either or, but the idea that climate (namely erosion) could drive crustal processes is kind of hard to swallow for many geologists. Some of the evidence for this involves correlations between erosion rates, rainfall, and uplift rates in active mountain belts. This isn't supposed to work everywhere, there are plenty of places that get tons of rain but where nothing is being uplifted (like the Amazon basin), but many people think of it as a major driver in mountainous regions. Frank Lisker presented a paper on some of his results from Sri Lanka, and what struck me is that the southern part of the island has a rather large mountain (2000+ meters) and gets buckets of rain, but has i n c r e d i b a l l y s l o w uplift rates, slow enough they are reported in meters per million years (typically we report uplift rates in kilometers per million years).
 More massive piles of Late Miocene - Pliocene conglomerates
So I think that is all I'm going to write on this. It gets difficult to decide what talks to highlight and what talks not to highlight. If you have found any of the things I've discussed intriguing, download and enjoy the abstract volume.
 More pillow basalts from the Kenai Peninsula. Seriously, they actually look like pillows!
 And my last Alaskan fall picture
Tuesday, October 14, 2008
FT2008 - Alaska chapter 2

As I mentioned in my last post, the scientific program at FT2008 (The International Conference on Thermochronometry in Anchorage) was overall pretty impressive. I thought I'd highlight a few of the presentations that I found most interesting. As a side note, the extended abstracts for this meeting can be downloaded for free from the official meeting website here. The abstracts vary in length, but most are true extended abstracts with color figures. My discussion is by no means exhaustive, and who knows, I might augment it later. Here are some of my highlights, interspersed with random pictures of mine from the field trips. I am primarily sticking to methodological highlights today, I'll save the others for later posts.
- There were many discussions and presentations by one of the meeting sponsors, Autoscan. Autoscan is an Australian company that has been working to develop an automated fission-track counting system. I am still in the early stages of learning to count tracks, but I've observed the process and know most of the basics. Counting fission tracks is exactly what it sounds like, fission-tracks are etched in acid, and then using a microscope you count the number of tracks in your grain (gross oversimplification, I know, but to make a point). So counting tracks can be tedious, you need to count hundreds of them from dozens of grains to beef up your statistics. Anyways, as nice as it would be to have an automated counting system, the mechanics and potential complications of the process make me wary of trusting an algorithm. That being said, the Autoscan demonstrations are pretty convincing. You can download the demonstration and demo images from the Autoscan website here. Andy Gleadow gave the presentations on Autoscan and led the discussions. He went into detail about how the software deals with some of the more specific problems, comparing reflected and transmitted light images, evaluating overlapping tracks, distinguishing tracks from scratches and dust, etc. By the end I was sold. Again, I am not a certified fission track counter [yet], and therefore am undoubtably missing some important caveats, but Autoscan impresses me.

- Speaking of fission-tracks, there were another set of talks and posters by the group from Union College/SUNY Albany (John Garver and his student Matt Montario) about their recent work using a scanning electron microscope to date high track density zircon samples. The problem is this: Fission-track dating works because with time, tracks form in U-bearing minerals due to the spontaneous fission of 238U. Old and/or U-rich samples can accumulate so many tracks that they become impossible to count; they overlap and obscure each other too much. The Union/Albany group has developed techniques that allow them to count very high density samples. They do this by using a modified etchant (super secret recipe, well, until they get it published that is) and a scanning electron microscope. Typically, fission-tracks are etched with acid so they become large enough to see with an optical microscope. But, if you have a lot of tracks, this is a problem. So by using a less aggressive etchant, and more powerful microscope, they are able to effectively count samples that would otherwise be useless. I am assuming this will all be published soon, so I'll keep you updated.
- Barry Kohn presented some work he has been doing attempting to reduce single-grain apatite (U-Th)/He age spread in quickly cooled samples. Apatite (U-Th)/He thermochronology has been in widespread use for a little over a decade now, and as more and more data sets are collected, we are starting to identify and grapple with recurring problems. Perhaps the most significant issue are irreproducible single-grain ages. These are samples that appear well-suited for analysis, and have easily measurable quantities of U, Th, Sm, and He. Despite this, it is not uncommon for grains from the same hand sample to show significant scatter, well beyond what you'd expect from simple analytical uncertainty. There are many reasons why you'd actually expect significant single-grain scatter in slowly cooled samples. I won't go into it, but instead refer you to Fitzgerald et al., (2006) for a review. For quickly cooled samples, however, there shouldn't be as many complicating factors. Kohn presented results from his experiments where grains are abraded prior to analysis. Air-abrasion removes the outer rind of the crystals, leaving just a rounded core. Air-abrasion has the potential to deal with the "bad neighbor" problem in apatite (U-Th)/He thermochronology. "Bad neighbors" are U, Th, and/or Sm bearing phases that are close to or in contact with the apatite crystal in the rock. Because the He atoms move about 20 microns or so when they are expelled from their parent atom, He produced in neighboring phases can be implanted into the apatite. You end up with "parentless" He, which gives you artificially old ages. So, the idea is that if you abrade off the rind, you remove the region that could have had "parentless" He implanted into it. Kohn isn't trying to say that this is the only answer or that it always works, but in some of the samples he analyzed it certainly had the desired effect. Namely, abraded grains showed less scatter and were more consistent with fission-track ages and/or other constraints. Obviously still a lot of work to be done, but again, very intriguing.

So those are some of the presentations I have thought about the most since I got back from Alaska. I'll have more highlights in later posts. I'll also have more pictures, including a special Alaskan wildlife post, and a brief discussion of our stop at the Wasilla town hall. Yes, we stopped in Wasilla. But before I leave, here is a picture I took of the Exit Glacier, I tried to get the glacial striae in the foreground with the big looming wall o' ice in the background. Unfortunately I couldn't Photoshop out the guard rope and warning sign.

Fitzgerald, P. G., S. L. Baldwin, L. E. Webb, and P. B. O'Sullivan (2006), Interpretation of (U-Th)/He single grain ages from slowly cooled crustal terranes: A case study from the Transantarctic Mountains of southern Victoria Land, Chemical Geology, 225, 91-120.
Wednesday, September 24, 2008
FT2008 - Alaska chapter 1
 There are many potential reasons why the world's leading thermochronology blog has been utterly silent for the past few months. This has nothing to do with the world of thermochronology, which as I'll discuss in a bit is as cutting edge and fast paced as ever. No, this has more to do with the authors life, motivation, and workload. I am attempting re-entry, this time with the proper heat sheild as to avoid blog burn up. The score so far, sense 0, tangential metaphors 1.
I am going to report on last week's International Thermochronology Conference (called FT2008 as a remnant of the meeting's origin as a fission-track conference), probably in installments of some kind. This was my first "specialist" type conference, which I have to say is a great idea. First off, I was interested in all of the talks and posters. This of course never happens at large conferences. Well, to be fair, I might find all of the presentations at AGU or GSA interesting if I was an expert/aficionado in the subject, it is tough to get into things that you just don't get (like cricket). In addition, there was only one session, everyone saw every talk and had time to go to every poster session. No dog-eared copy of the program or guestimates of if you can make it to the next room in 2 minutes. No, once set your were firmly planted in the session. There were enough coffee and poster breaks that I didn't get meeting sores.
But I think the best part of being at a specialist conference is that it gives the attendees a chance to discuss things that wouldn't really fit at AGU, GSA, EGU, or even a Goldschmidt (although to be fair I haven't attended the latter two). We all have issues with data collection, analysis and reduction, modeling, and/or consistency. We as a community have specific techniques, or aspects of specific techniques we are still trying to make sense of. And, we are all interested in new developments in the hardware and software we use every day. These things just don't make most large conferences. These things came up all the time at FT2008, both in the formal sessions, as well as over beers later on.
Not that it was all songbirds and sunshine. There were a fair number of talks that were just not that great. Like a soufflé, thermochronology is something that it is easy to F-up; in the field, lab, or at your computer. There were too many talks where I got the feeling the author had never read many thermochronology papers. This isn't much of an exaggeration, I'd say one of the most glaring errors involved ignoring (sometimes landmark) previous work from the same field area. Usually though it had to do with the study design and sampling strategy, or interpretation.
But today I'm going to talk briefly (read: show pictures) about the pre-meeting field trip. This was my first trip to Alaska, and I was very lucky to get in on the 2.5 day trip north to Denali. The trip included about 40 people, faculty, students, and even some industry and government folks. The trip covered a lot of different topics, and was for most of us an introduction to the geology of South Central Alaska.
This may seem obvious, but the trip really reinforced to me the enormity of Alaska, and the complexity of Alaskan geology. The area we discussed was larger than some states. Exposure is not ideal, neither is access. And, like many areas that are still active, there are generations of structures and events that are continually being modified and obscured.
As far as rocks go, most of the features we saw were large overview things, the trace of the Denali and Castle Valley Faults, some of the different large mountain belts, features from the 1964 earthquake, etc. We did see some excellent exposures of some of the ginormous piles of conglomerates shed off the various mountain ranges. I make no pretense of being a sedimentologist, but even these had me impressed.
The weather hid most of the dramatic views on the first day, but we did have this one fantastic view of Denali from the park road.

We were also smack dab in the middle of the fall colors coming out. This is a picture I took from Honolulu Creek, one of the exposures of these piles of late Miocene-Pliocene conglomerates we spent some time arguing about. The exact age of the deposits isn't too well constrained, but they are believed to be correlative to the Pliocene Nenana gravels. The Nenana gravels are interpreted by the field trip leaders to result from the unroofing of the Alaska Range.

The meeting included some talks I'll hopefully post about that discuss some of the more recent thermochronology in this part of Alaska. We did talk a great deal about one of the more "landmark" thermochronology papers that happens to come from this area, which focused on an elevation transect all the way up Mount Denali (see Fitzgerald et al., 1995; the top of the fossil apatite fission-track partial annealing zone is at about 3800m).
More later, I bought some sourdough starter while there and now need to go attend to loaves.
Fitzgerald, P.G., Stump, E., and Redfield, T. F., 1993, Late Cenozoic uplift of Denali (Mt. McKinley) and its relation to relative plate motion and fault morphology, Science, v. 259, p. 497-499.
Thursday, June 26, 2008
Zotero and Citation Managing
Like many paper-writing academic types, I typically employ a haphazard and ill-planned technique for reference-handling when writing papers. I have EndNote and BibTeX, and I have used them both at times, but I really have never been entirely satisfied. I have liked EndNote at times, but the truth is the version I have is old and clunky, and I am not all that thrilled about plunging another $100 some-odd dollars into an updated version. BibTeX was great while I was using LaTeX, but most earth science journals do not accept LaTeX file submissions, and none of my collaborators are ever comfortable with LaTeX, which means I have to constantly import and export from Microsoft Word to LaTeX and back. A pain. Plus, BibTeX is great for most things, but putting out a .rtf formatted bibliography is not one of them. So to summarize, I want something cheap (read: free) that works well with Microsoft Word (the standard for my collaborators).
Enter Loose Baggy Monster, my better half. One of her favorite things in the world is playing with new word processing related software. Seriously, I'm not joking. She is especially excited about reference management utilities and other things that let her release her humanities dorkosity.
She pointed me toward Zotero, a free reference and bibliography management utility that works through FireFox, and integrates beautifully with Word 2004. I've now become a convert, and decided it is time to spread the word. Now, there are many features in Zotero I don't yet use or understand, and I am sure in the future I'll do a better job showing off it's power, but here are some screen shots describing why I like Zotero. Oh, and if you want, click on the pictures to see higher resolution versions.
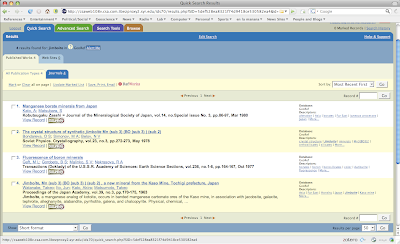
First off, Zotero makes importing references into your database very easy. I do all of my reference searching on web-based applications, such as my current GeoRef interface (shown below).
You will notice that in the browser address bar, there is a little orange folder. That means that this page has enbedded bibliographic information that Zotero can read, and import directly into your database. This is a GeoRef search for the term "jimboite."
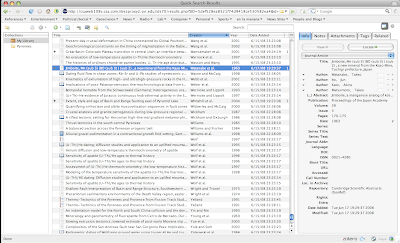
If you click the orange folder, a window appears with all of references that appear on the page. You select which ones you want in your database, and once you click OK that are imported. You can see that there is another window on the bottom right showing the references that are currently being imported.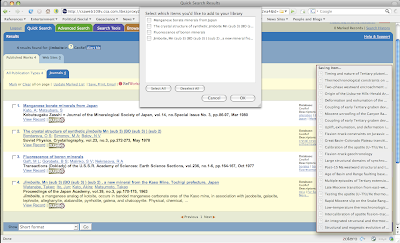 You will also notice that on the bottom of my browser window, there is the little "Zotero" icon. If you click this, you are taken to your personal database. You can see that one of the articles I had searched for and selected in my "jimboite" search is now in my database. I should mention here that this database is held on your hard drive, so even though it runs through a web browser, you don't have to be online to access your downloaded or otherwise entered database. Nor must you be on the interwebs to use the "cite while you write" functionality in Word 2004.
So now lets go to Word and start writing that landmark paper. You can see that because I installed the free Zotero plugin for Word, I have a little Zotero menu bar up on the top of the screen shot. So I've written my first stunning introductory sentence, and now want to insert a reference. I click one of the menu bar buttons.

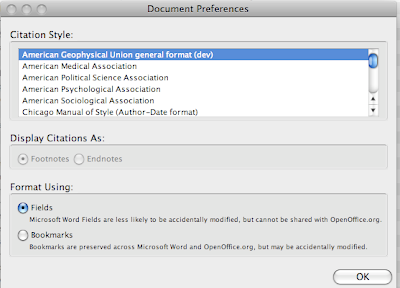
And this window comes up. I can select what citation style I want to use. Truth is there aren't as of yet that many earth science citation styles available, but someone did make the AGU general style, which I tend to like. On the Zotero web site you can download and install the AGU style (it does not come standard), and there is also a style-maker that I have yet to figure out.
After I click AGU, I am then shown a window where I select the reference that I want to include. You can chose one or multiple, either way it is pretty simple.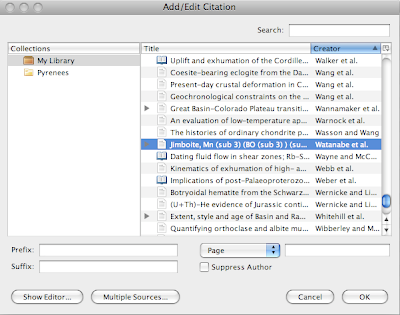
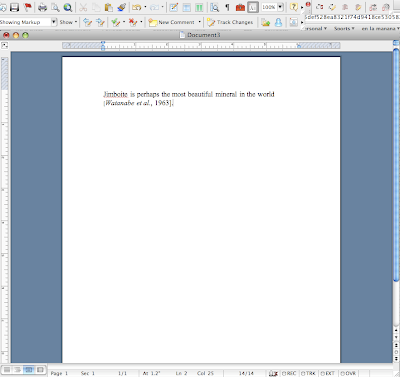
Click "OK" and voila! the paranthetical citation is entered into the word file.
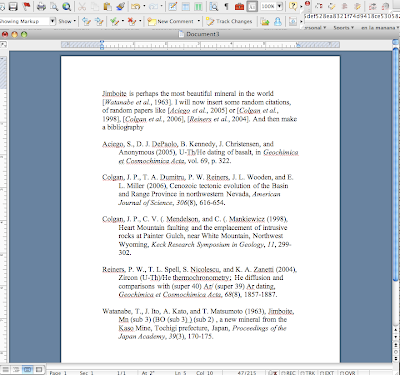
So now I'll add some more text and reference, and then click the menu bar button that says "Zotero Insert Bibliography" and Ka-Bam! Instant formatted bibliography.
Now GeoRef isn't the only web search engine that lets you download references straight away. Most of the individual publisher or journal web pages do as well. There are plenty of other features I like, for example you can take snapshots of web pages if you wish to record and later reference those; you can link references in your database directly to the .pdf's on your hard drive, and so on.
There are some things I want Zotero to improve on. First I'd like more citation styles. Zotero also does not have any decent way to sort out duplicate references, which is a headache. But, Zotero is one of those programs it seems is improving quickly. And hell, it's free!
So as of now I am a convert.
Enter Loose Baggy Monster, my better half. One of her favorite things in the world is playing with new word processing related software. Seriously, I'm not joking. She is especially excited about reference management utilities and other things that let her release her humanities dorkosity.
She pointed me toward Zotero, a free reference and bibliography management utility that works through FireFox, and integrates beautifully with Word 2004. I've now become a convert, and decided it is time to spread the word. Now, there are many features in Zotero I don't yet use or understand, and I am sure in the future I'll do a better job showing off it's power, but here are some screen shots describing why I like Zotero. Oh, and if you want, click on the pictures to see higher resolution versions.
First off, Zotero makes importing references into your database very easy. I do all of my reference searching on web-based applications, such as my current GeoRef interface (shown below).
You will notice that in the browser address bar, there is a little orange folder. That means that this page has enbedded bibliographic information that Zotero can read, and import directly into your database. This is a GeoRef search for the term "jimboite."

If you click the orange folder, a window appears with all of references that appear on the page. You select which ones you want in your database, and once you click OK that are imported. You can see that there is another window on the bottom right showing the references that are currently being imported.
 You will also notice that on the bottom of my browser window, there is the little "Zotero" icon. If you click this, you are taken to your personal database. You can see that one of the articles I had searched for and selected in my "jimboite" search is now in my database. I should mention here that this database is held on your hard drive, so even though it runs through a web browser, you don't have to be online to access your downloaded or otherwise entered database. Nor must you be on the interwebs to use the "cite while you write" functionality in Word 2004.
So now lets go to Word and start writing that landmark paper. You can see that because I installed the free Zotero plugin for Word, I have a little Zotero menu bar up on the top of the screen shot. So I've written my first stunning introductory sentence, and now want to insert a reference. I click one of the menu bar buttons.

And this window comes up. I can select what citation style I want to use. Truth is there aren't as of yet that many earth science citation styles available, but someone did make the AGU general style, which I tend to like. On the Zotero web site you can download and install the AGU style (it does not come standard), and there is also a style-maker that I have yet to figure out.

After I click AGU, I am then shown a window where I select the reference that I want to include. You can chose one or multiple, either way it is pretty simple.

Click "OK" and voila! the paranthetical citation is entered into the word file.

So now I'll add some more text and reference, and then click the menu bar button that says "Zotero Insert Bibliography" and Ka-Bam! Instant formatted bibliography.

Now GeoRef isn't the only web search engine that lets you download references straight away. Most of the individual publisher or journal web pages do as well. There are plenty of other features I like, for example you can take snapshots of web pages if you wish to record and later reference those; you can link references in your database directly to the .pdf's on your hard drive, and so on.
There are some things I want Zotero to improve on. First I'd like more citation styles. Zotero also does not have any decent way to sort out duplicate references, which is a headache. But, Zotero is one of those programs it seems is improving quickly. And hell, it's free!
So as of now I am a convert.
Sunday, June 01, 2008
Brian Greene in the NY Times
The better half and I just returned from vacation this week (contrary to the comment I recently received, the blog break has not been NSF-induced, but rather from an incredible week + vacationing.) I am adjusting to the time and lifestyle change fine, and spent most of the weekend getting back on track (including a few visits to a lab undergoing a bakeout). This morning I ran across this article in the NY Times by Brian Greene (physicist and author of many popular science books.) It starts with a description of a letter he received from a soldier stationed in Iraq, the kind of letter anyone who fancies themselves a writer must be thrilled to receive. He then spends some time discussing the status of science education in the US. As a scientist who is interested in science education, I thought it was worth linking to.
My only beef is that when discussing the issue of science education Green writes:
My only beef is that when discussing the issue of science education Green writes:
It’s much the same story in classes for biology, chemistry and mathematics.
You might notice that once again geology and/or earth science is not given a place on the list of important sciences. I am sure Greene has no problem with geology, that is not what I mean, I just think it is sad how often the "important" sciences are listed off with nary a mention of the science that studies the planet we live on. Other than that, the article is worth a read. He makes the point that science education is "unassailably vertical [paraphrased]" and too often focuses on teaching skills and forgets to involve the grand ideas, the things that might inspire students to want to learn the skills. Or as he writes:
Like a music curriculum that requires its students to practice scales while rarely if ever inspiring them by playing the great masterpieces, this way of teaching science squanders the chance to make students sit up in their chairs and say, “Wow, that’s science?”
This is the second time I've blogged about a prominent scientist somehow appearing in the NY Times and forgetting to include geology as an important science. The first time is here, in an article that quotes nobel laureate Leon Lederman.
Sunday, May 11, 2008
Mother's Day
Every mother's day I tend to balance my general dislike for the Hallmark Holidays with my overwhelming love, thanks, and appreciation for my mom. My balance usually ends up with me calling her, something I should do more often. While in grad school I was lucky enough to attend a poetry reading by then Poet Laureate Billy Collins. I like Billy Collins a great deal. One of my favorite poems of his is called "The Lanyard."
OK, time to connect the thoughts in the previous paragraph. As Apparent Dip's mother's day offering, I bring you "The Lanyard" by Billy Collins. You can hear him read this here, or on this excellent CD. As a copyright note, I am only putting the text up because NPR did, and I figure if NPR thinks it is OK, then so does Apparent Dip. I think most poems are best listened to, so check out the links above.
OK, time to connect the thoughts in the previous paragraph. As Apparent Dip's mother's day offering, I bring you "The Lanyard" by Billy Collins. You can hear him read this here, or on this excellent CD. As a copyright note, I am only putting the text up because NPR did, and I figure if NPR thinks it is OK, then so does Apparent Dip. I think most poems are best listened to, so check out the links above.
The Lanyard - by Billy Collins
The other day as I was ricocheting slowly
off the pale blue walls of this room,
bouncing from typewriter to piano,
from bookshelf to an envelope lying on the floor,
I found myself in the L section of the dictionary
where my eyes fell upon the word lanyard.
No cookie nibbled by a French novelist
could send one more suddenly into the past --
a past where I sat at a workbench at a camp
by a deep Adirondack lake
learning how to braid thin plastic strips
into a lanyard, a gift for my mother.
I had never seen anyone use a lanyard
or wear one, if that’s what you did with them,
but that did not keep me from crossing
strand over strand again and again
until I had made a boxy
red and white lanyard for my mother.
She gave me life and milk from her breasts,
and I gave her a lanyard.
She nursed me in many a sickroom,
lifted teaspoons of medicine to my lips,
set cold face-cloths on my forehead,
and then led me out into the airy light
and taught me to walk and swim,
and I, in turn, presented her with a lanyard.
Here are thousands of meals, she said,
and here is clothing and a good education.
And here is your lanyard, I replied,
which I made with a little help from a counselor.
Here is a breathing body and a beating heart,
strong legs, bones and teeth,
and two clear eyes to read the world, she whispered,
and here, I said, is the lanyard I made at camp.
And here, I wish to say to her now,
is a smaller gift--not the archaic truth
that you can never repay your mother,
but the rueful admission that when she took
the two-tone lanyard from my hands,
I was as sure as a boy could be
that this useless, worthless thing I wove
out of boredom would be enough to make us even.
Saturday, May 03, 2008
Thermochronologic Sampling
I've posted about thermochronology and mineral separations (twice), but I realized that I haven't yet gone over the field work aspect of thermochronology.
Now, I'll admit up front that the field work I do is not very hard core. There are plenty of thermochronologists who spend months in the classic style, mapping and sampling in some remote part of the planet, I am really not one of them. The most rugged field work I've done was when I was in college, and while the helicopter rides and grizzly bears gave me some geo-street cred, my field work since then has been rather tame. The truth is, as a thermochronologist, you rely on good maps. Your data is meaningless outside of geologic or structural context. Now, it is pretty commong for people doing thermochronology to provide the necessary structural and geologic underpinnings. For much of my work, I've been fortunate enough to work in places that have been mapped very well, and I'm often in field parties with the people who've done the mapping.
Anyways, what I am going to be blogging about assumes you either have or are making the maps necessary for actually understanding your data.
OK, first things first, you can take a thermochronologic sample anywhere there are rocks, but when you plan your sampling, there are some important things to consider.
First, although you can get important information from single samples, the most powerful sampling method involves collecting multiple samples from different structural positions. If cooling and exhumation have been vertical (as is the case with my current project, see this for a more in depth discussion), then this means collecting samples at different elevations. For reasons I'll explain in a later post, it helps to cover as much structural relief as possible without moving too much laterally. The ideal sampling surface in a region with vertical exhumation would be a sheer cliff. In regions like the basin and range, where faults and structures have rotated lithologic units, structural relief might be almost horizontal (like Yerington). Again, this is why you need to already understand your field area.
So lets just say that exhumation has been vertical. Your sampling transect will try to cover the greatest amount of relief possible.
In almost every case, the best lithologies to sample for thermochronology are granites or granodiorites. So to summarize, you are looking for a big granite mountain.
Unless you are attempting some rather specialized analyses, you also want fresh and underformed rocks to sample. Obviously then, avoid altered rocks, weathering varnishes, and rocks that have been faulted or otherwise chewed on. You will also want to avoid the outer few cm's of outcrop because of potential problems caused by forest fires (see Mitchell and Reiners, 2003, Geology v.31, n.12, pp.1025-1028; summary if you don't have access, fires can reset apatites, so don't sample the outer few cm's. They do very interesting things with the data, but I won't go into that right now).
OK, so find your enormous granite mountain made entirely of fresh outcrop (this sounds pipe dreamy, but actually describes some of my current field areas).
So you want to take a whole slew of samples from different elevations. It is pretty standard to sample every 100 meters or so of relief (structural relief or elevation). So, first step, find a place at the right elevation that has fresh outcrop. As below

If the rocks aren't that well exposed or fresh, it helps to spend some quality time with your chisel. I love the ones with the hand guards. If you are sampling granitoids, bring a sledge hammer, not a pick hammer. Sledge hammers (3 or 4 lb head, metal or wood handle) make the job much easier. check out Dr. New Helvetia chiseling away at an oriented sample

If you are interested in mica, hornblende, or K-Feldspar, you usually don't need much sample at all. You can often see the minerals you want to analyze with your hand lens, and can sometimes "field dress" your sample, and take out what you want with your knife (works well especially for books of mica). For apatite, zircon, and monazite, you have a lot more work ahead of you. since the first step in that mineral separation might mean feeding your sample through a jaw crusher, I find it useful to break your sample into bite sized chunks on the outcrop. If you wait to bash up a large sample into smaller pieces back in the lab, you have to spend all kinds of time cleaning up. You don't have to clean up or worry about contamination if you bash things up on the outcrop. Bashing things up also lets you remove the weathered rinds you want to avoid.
Many rocks seem to be either feast or famine when it comes to apatite and zircon abundance. Some rocks I've worked on yield piles and piles of apatite, where I could have gotten away with much less sample. Others yield nothing, and it wouldn't have mattered if I would have brought home a barrel's worth. I usually go for about 3-4 kgs of sample.
So you've now got your mandarin orange sized chunks of amazingly fresh granite, time to bag them. I prefer heavy cloth bags, like those available here at Miners Inc. I don't reuse them, so I label the bajeesus out of the bags with a Sharpie.

I write the sample name, elevation, and some basic info about the geologic context of the sample. I also like to take a picture of the sample bag (with the sample name readable) on the outcrop, kind of a way to help me remember the sample and where I took it. I also take a GPS reading, and plot myself manually on a topographic map. I'll actually check my map location against the GPS whenever possible.
 This is also a good way to trick otherwise camera shy members of a field party to have their picture taken. Again, Dr. New Helvetia.
 Taking pictures like this also helps me keep my photos organized. For example, I'll have pictures like this below, that I don't write a ton about in my field book (because I am an idiot who is still acquiring skills), but I have it sandwiched in between pictures I have GPS coordinates for, so I'm all good. I was able to recreate the outcrop where I saw these enormous K-feldspars, even though it was towards the end of the day and my field notes weren't as complete as they should have been.
The K-feldspars remind me of salmon swinning upstream.
 Now, I usually have a back-and-forth sampling route. Meaning, I'll hike up to the highest point in my field area, take a sample, and then head down, sampling as I go. This saves you from having to carry rocks up hill, which is usually a good thing. I also find it easy to plan time this way. I plan on eating lunch at the highest point, and I know that I can cover ~1300 m of elevation in a day (13 samples) with a good field party (at least 1 other person). You can also note good outcrops on your way up, making the way down more efficient.
Now, I'll admit up front that the field work I do is not very hard core. There are plenty of thermochronologists who spend months in the classic style, mapping and sampling in some remote part of the planet, I am really not one of them. The most rugged field work I've done was when I was in college, and while the helicopter rides and grizzly bears gave me some geo-street cred, my field work since then has been rather tame. The truth is, as a thermochronologist, you rely on good maps. Your data is meaningless outside of geologic or structural context. Now, it is pretty commong for people doing thermochronology to provide the necessary structural and geologic underpinnings. For much of my work, I've been fortunate enough to work in places that have been mapped very well, and I'm often in field parties with the people who've done the mapping.
Anyways, what I am going to be blogging about assumes you either have or are making the maps necessary for actually understanding your data.
OK, first things first, you can take a thermochronologic sample anywhere there are rocks, but when you plan your sampling, there are some important things to consider.
First, although you can get important information from single samples, the most powerful sampling method involves collecting multiple samples from different structural positions. If cooling and exhumation have been vertical (as is the case with my current project, see this for a more in depth discussion), then this means collecting samples at different elevations. For reasons I'll explain in a later post, it helps to cover as much structural relief as possible without moving too much laterally. The ideal sampling surface in a region with vertical exhumation would be a sheer cliff. In regions like the basin and range, where faults and structures have rotated lithologic units, structural relief might be almost horizontal (like Yerington). Again, this is why you need to already understand your field area.
So lets just say that exhumation has been vertical. Your sampling transect will try to cover the greatest amount of relief possible.
In almost every case, the best lithologies to sample for thermochronology are granites or granodiorites. So to summarize, you are looking for a big granite mountain.
Unless you are attempting some rather specialized analyses, you also want fresh and underformed rocks to sample. Obviously then, avoid altered rocks, weathering varnishes, and rocks that have been faulted or otherwise chewed on. You will also want to avoid the outer few cm's of outcrop because of potential problems caused by forest fires (see Mitchell and Reiners, 2003, Geology v.31, n.12, pp.1025-1028; summary if you don't have access, fires can reset apatites, so don't sample the outer few cm's. They do very interesting things with the data, but I won't go into that right now).
OK, so find your enormous granite mountain made entirely of fresh outcrop (this sounds pipe dreamy, but actually describes some of my current field areas).
So you want to take a whole slew of samples from different elevations. It is pretty standard to sample every 100 meters or so of relief (structural relief or elevation). So, first step, find a place at the right elevation that has fresh outcrop. As below

If the rocks aren't that well exposed or fresh, it helps to spend some quality time with your chisel. I love the ones with the hand guards. If you are sampling granitoids, bring a sledge hammer, not a pick hammer. Sledge hammers (3 or 4 lb head, metal or wood handle) make the job much easier.
 check out Dr. New Helvetia chiseling away at an oriented sample
If you are interested in mica, hornblende, or K-Feldspar, you usually don't need much sample at all. You can often see the minerals you want to analyze with your hand lens, and can sometimes "field dress" your sample, and take out what you want with your knife (works well especially for books of mica). For apatite, zircon, and monazite, you have a lot more work ahead of you. since the first step in that mineral separation might mean feeding your sample through a jaw crusher, I find it useful to break your sample into bite sized chunks on the outcrop. If you wait to bash up a large sample into smaller pieces back in the lab, you have to spend all kinds of time cleaning up. You don't have to clean up or worry about contamination if you bash things up on the outcrop. Bashing things up also lets you remove the weathered rinds you want to avoid.
Many rocks seem to be either feast or famine when it comes to apatite and zircon abundance. Some rocks I've worked on yield piles and piles of apatite, where I could have gotten away with much less sample. Others yield nothing, and it wouldn't have mattered if I would have brought home a barrel's worth. I usually go for about 3-4 kgs of sample.

So you've now got your mandarin orange sized chunks of amazingly fresh granite, time to bag them. I prefer heavy cloth bags, like those available here at Miners Inc. I don't reuse them, so I label the bajeesus out of the bags with a Sharpie.

I write the sample name, elevation, and some basic info about the geologic context of the sample. I also like to take a picture of the sample bag (with the sample name readable) on the outcrop, kind of a way to help me remember the sample and where I took it. I also take a GPS reading, and plot myself manually on a topographic map. I'll actually check my map location against the GPS whenever possible.
 This is also a good way to trick otherwise camera shy members of a field party to have their picture taken. Again, Dr. New Helvetia.
 Taking pictures like this also helps me keep my photos organized. For example, I'll have pictures like this below, that I don't write a ton about in my field book (because I am an idiot who is still acquiring skills), but I have it sandwiched in between pictures I have GPS coordinates for, so I'm all good. I was able to recreate the outcrop where I saw these enormous K-feldspars, even though it was towards the end of the day and my field notes weren't as complete as they should have been.
The K-feldspars remind me of salmon swinning upstream.
 Now, I usually have a back-and-forth sampling route. Meaning, I'll hike up to the highest point in my field area, take a sample, and then head down, sampling as I go. This saves you from having to carry rocks up hill, which is usually a good thing. I also find it easy to plan time this way. I plan on eating lunch at the highest point, and I know that I can cover ~1300 m of elevation in a day (13 samples) with a good field party (at least 1 other person). You can also note good outcrops on your way up, making the way down more efficient.
Thursday, May 01, 2008
FT2008 Early Registration Deadline

The early registration deadline for the 11th International Conference on Thermochronometry is tomorrow! Get the purchase card and sign up now, otherwise your grant will have to pony up another 50$. All the information you'll need can be found here. The meeting is in Anchorage, from September 15-19. I've never been to this conference, but reliable sources tell me they have been excellent in the past.
The FT conferences started out as Fission-Track workshops, but have expanded to include all low-temperature thermochronometers. There will be a wide range of posters and talks at the conference. The conveners are specifically requesting papers that fall into these categories:
1) New analytical developments in helium dating and fission-track analysis
2) Thermochronology of orogenic belts
3) Detrital thermochronology, provenance, and basin analysis
4) Thermochronology of sedimentary basins
5) Kinetics and thermal modeling
6) The thermotectonic framework of Alaska and adjacent areas.
Abstract and final registration deadline is June 13th, still time to crank out some ages!
Incidentally, speaking of abstracts, when writing them I always like to paraphrase our former Secretary of Defense and say "You write abstracts with the data you have, not the data you want."
Saturday, April 26, 2008
Great Gift Idea for that Geochronologist in Your Life
I just wanted to mirror a post on the Arizona Geology Blog in case you know any geochronologists with upcoming birthdays, or wanted to get a head start on the Holiday shopping season. This could be the very first gift item aimed directly at us "something"chronologists. And, seeing that this is the world's greatest thermochronology blog, I figured it was appropriate for me to point you here, where you can learn all about the PaleoClock!
Monday, April 07, 2008
Eocene Farallon Lithospheric Chalupa
Also see my second post relating to the Farallon Plate here.
This past Friday I was talking with some of the people in my research group and we ended up discussing our favorite published figures. This is easy for me, hands down, it is the Eocene Farallon Lithospheric Chalupa of Humphreys (1995). I'll explain why I love this figure in a minute, but first...
I don't think I'd be out on a limb to say that when many geologists first look at a paper, they begin by studying the figures. Many branches of geology are very visual, the ultimate goal often being complete 4 dimensional reconstructions of complicated events. As such, most earth scientists spend a great deal of time learning how to make good figures. For many geologists, the steep part of this learning curve is field camp, when they first learn how to make geologic maps.
I think if you want to consider the information density of a figure, nothing can beat a geologic map. I am continually amazed at the amount of information that trained geologists can gather from geologic maps. The amount of information packed into a geologic map of course depends on the quality and scale of the map itself, but really good maps can detail billions of years of faulting, folding, erosion, magmatism, deposition, and metamorphism.
And one more "quick" aside. I think that my general reverence for geologic maps has played into my slight annoyance with Edward Tufte. This is probably entirely stupid and absurd on my part; I apologize in advance and fully accept criticism, but I am continually amazed that Tufte doesn't spend more time singing the praises of geologic maps. I had a chance to attend a public lecture by Tufte a few years ago. In general, I am a big fan of many of Tufte's ideas. I think that many people, geologists included, need to think seriously about how they visually represent their information. I think that geologists already have to spend a lot of time doing this, and so some of the examples seem kind of basic. I think this molehil of an annoyance of mine became a small end moraine of annoyance when I saw Tufte speak. First the background, this was a public lecture attended by about 600 people. Although Tufte is not categorically against things like PowerPoint or slides, he is much more in favor of archival quality paper. Unfortunately, these are expensive, and impractical for 600 people. So, the first 200 or so people who got into this lecture had beautiful large images to look at during the talk, images on such incredible paper that they are undoubtedly as bright and colorful today as they were 2 years ago. The rest of us got to crowd a dozen or so people around a single piece of paper, trying to follow along with his message. I would have loved a crappy PowerPoint slide complete with kitten background and lightning sound effects. I guess I am saying that I think it is important to strike a balance between quality and accessibility.
Long story short, I get a little bit stuck-up when it comes to geologists and visual representations of data. That is why I've decided to start blogging about some of my favorite figures.
So to start we have the Eocene Farallon Lithospheric Chalupa, published in 1995 in a paper by Eugene Humphreys (Geology, v. 23, n. 11, pp. 987-990). What this figure shows is his preferred model for the removal of the Eocene Farallon slab. The idea is that during the Laramide orogeny, the Farallon slab was subducting at a very shallow angle, effectively transferring plate boundary forces into the interior of the continent during the Laramide orogeny (making some of the Rocky Mountain structures). Beginning in the Eocene this slab was somehow removed, allowing hot asthenosphere to rise up and introduce a great deal of heat and basaltic magma into the western North American lithosphere. This led to the "ingimbrite flare-up," a period of intense volcanic activity in western North America, from Washington in the north down into northern Mexico. Volcanic activity did not begin everywhere at the same time, in fact it seems to have started at the northern and southern margins of the province in the Eocene. The volcanic front moved south from Washington, and north from Mexico, eventually meeting around Las Vegas in the Miocene (Vegas baby!) Many geologists interpret this to be the result of the gradual peeling away of the Farallon slab from both the north and south at roughly the same time.
So, here is the figure, the Eocene (~35 Ma) Farallon Slab!

So, with that background, what Humphreys attempts to explain in this paper is that pattern of magmatism, and how it could be related to slab removal. My favorite figure is his preferred model for Farallon slab removal. Why do I love this figure? Well.
This past Friday I was talking with some of the people in my research group and we ended up discussing our favorite published figures. This is easy for me, hands down, it is the Eocene Farallon Lithospheric Chalupa of Humphreys (1995). I'll explain why I love this figure in a minute, but first...
I don't think I'd be out on a limb to say that when many geologists first look at a paper, they begin by studying the figures. Many branches of geology are very visual, the ultimate goal often being complete 4 dimensional reconstructions of complicated events. As such, most earth scientists spend a great deal of time learning how to make good figures. For many geologists, the steep part of this learning curve is field camp, when they first learn how to make geologic maps.
I think if you want to consider the information density of a figure, nothing can beat a geologic map. I am continually amazed at the amount of information that trained geologists can gather from geologic maps. The amount of information packed into a geologic map of course depends on the quality and scale of the map itself, but really good maps can detail billions of years of faulting, folding, erosion, magmatism, deposition, and metamorphism.
And one more "quick" aside. I think that my general reverence for geologic maps has played into my slight annoyance with Edward Tufte. This is probably entirely stupid and absurd on my part; I apologize in advance and fully accept criticism, but I am continually amazed that Tufte doesn't spend more time singing the praises of geologic maps. I had a chance to attend a public lecture by Tufte a few years ago. In general, I am a big fan of many of Tufte's ideas. I think that many people, geologists included, need to think seriously about how they visually represent their information. I think that geologists already have to spend a lot of time doing this, and so some of the examples seem kind of basic. I think this molehil of an annoyance of mine became a small end moraine of annoyance when I saw Tufte speak. First the background, this was a public lecture attended by about 600 people. Although Tufte is not categorically against things like PowerPoint or slides, he is much more in favor of archival quality paper. Unfortunately, these are expensive, and impractical for 600 people. So, the first 200 or so people who got into this lecture had beautiful large images to look at during the talk, images on such incredible paper that they are undoubtedly as bright and colorful today as they were 2 years ago. The rest of us got to crowd a dozen or so people around a single piece of paper, trying to follow along with his message. I would have loved a crappy PowerPoint slide complete with kitten background and lightning sound effects. I guess I am saying that I think it is important to strike a balance between quality and accessibility.
Long story short, I get a little bit stuck-up when it comes to geologists and visual representations of data. That is why I've decided to start blogging about some of my favorite figures.
So to start we have the Eocene Farallon Lithospheric Chalupa, published in 1995 in a paper by Eugene Humphreys (Geology, v. 23, n. 11, pp. 987-990). What this figure shows is his preferred model for the removal of the Eocene Farallon slab. The idea is that during the Laramide orogeny, the Farallon slab was subducting at a very shallow angle, effectively transferring plate boundary forces into the interior of the continent during the Laramide orogeny (making some of the Rocky Mountain structures). Beginning in the Eocene this slab was somehow removed, allowing hot asthenosphere to rise up and introduce a great deal of heat and basaltic magma into the western North American lithosphere. This led to the "ingimbrite flare-up," a period of intense volcanic activity in western North America, from Washington in the north down into northern Mexico. Volcanic activity did not begin everywhere at the same time, in fact it seems to have started at the northern and southern margins of the province in the Eocene. The volcanic front moved south from Washington, and north from Mexico, eventually meeting around Las Vegas in the Miocene (Vegas baby!) Many geologists interpret this to be the result of the gradual peeling away of the Farallon slab from both the north and south at roughly the same time.
So, here is the figure, the Eocene (~35 Ma) Farallon Slab!

So, with that background, what Humphreys attempts to explain in this paper is that pattern of magmatism, and how it could be related to slab removal. My favorite figure is his preferred model for Farallon slab removal. Why do I love this figure? Well.
- It make sense. It takes a while to wrap your head around, but it explains the removal of the slab, and the associated patterns of magmatism.
- The perspective. The view is looking up from the mantle somewhere underneath eastern Canada. The view is looking to the west, with the subducting Farallon slab coming right at you. I am used to map view and cross-sectional views, but I love the moxy to use this perspective. I wish google earth had this view.
- The approximation. I like the fact that this is simplified and hand made. I don't think Illustrator has a feature that makes buckled subducting slabs. In my geologic education I have definitely felt pressure to make diagrams crisp and Illustrator-ific. I can imagine this figure originated on a sketchpad or (if I were to write this as a legend) cocktail napkin, and didn't get caught up in the refinement process.
- It reminds me of a chalupa. Not that I consider Taco Bell excellent cuisine, but the buckled Farallon slab is a dead ringer for an enormous chalupa. And, it should be noted, that downing chalupas can also lead to flare-up events. I love mexican food, and Taco Bell is a distant cousin of mexican food, so that makes me smile.
- I think my favorite thing though, is the fact that I didn't buy this figure at first. I first saw it in a seminar on Cordilleran geology when I was in graduate school. I remember spending a great deal of time trying to figure out what it was representing, and why this was the preferred model. At first I thought it was absurd and overly complicated. I am not an expert on slab removal or the ingimbrite flare-up, but I am now pro-Farallon Chalupa. Every time this figure comes up people who've never seen it are always unsure. Geology can be complicated. Geologic maps are complicated if you aren't used to looking at them. So I like that this image makes brains work. I don't think anyone immediately accepts this diagram, which is good. It is immediately interactive.

So what are your favorite figures? Any nominations? Feel free to nominate yourself if you have a figure you are particularly proud of.
Wednesday, January 16, 2008
Apparent Dip Music Club #6 - Stan Rogers
When I first started blogging, I had a regular feature I called the Apparent Dip music club. I'd find video clips on YouTube, embed them within a post, and boo-yah, instant entertainment. I haven't done this for a while; primarily because I've wanted to focus on geologic posts, but truth be told, there were many other reasons I felt a little unconformable posting videos. I found this video today, and decided to link because it absolutely made my afternoon. Let me explain.
I've been a big Stan Rogers fan since my sophomore year in college. I'd never heard of him growing up, but my undergraduate adviser had a tape of a Stan Rogers album he played once on a field trip. For some reason I became hooked. This was 1995, and after fruitlessly searching the record stores in Madison AND Berkeley (the two hippest places I visited that year), eventually found and bought my first Stan Rogers album (Between the Breaks, Live!) using some early online version of a music store. I forget the name, but I remember printing off an order form, mailing off a check, and then 3 weeks later getting two copies in the mail (one as a present for my brother.) I played and replayed this album hundreds of times; on field trips, in my dorm room, on the plane flights back to California to visit family, everywhere. After college, I found a few more Stan Rogers albums at Amoeba Music (Home in Halifax and From Fresh Water), and then later in grad school got a hold of Northwest Passage. Stan died long before I was aware of his music, when I was 7 actually, but I am still catching up with his catalog. Part of this has been the relative difficulty of finding his albums in the U.S., and always being on a budget entirely incompatible with buying import CD's. I've slowly accumulated albums, and a biography, but have never had a chance to see the CBC documentary about his life. Most of the facts in the documentary are things I knew, but what really fired me up was the live footage of him singing, especially the chorus to Northwest Passage. My two favorite albums of his are live albums (Between the Breaks, Live and Home in Halifax), but I'd never seen him perform.
I like all kinds of music, but I can rarely explain why. Stan Rogers is no exception. I have no experience with the activities he sings about (sailing, fishing, farming, etc...), and I am not Canadian (although I have a definite wanna-be Canadian streak). For whatever reason though, his songs truly resonate with me. That actually makes sense, because Stan wasn't any of those things either, well, except Canadian. But somehow he was able to embody peoples lives in his songs, and the ideas and emotions he sings about are pretty universal. Truth is when the weather turns a little foul, there is nothing better than his music.
My favorite parts of this movie are:
1. Stan and friends sitting around a kitchen table stomping and singing his most famous and song, Barret's Privateers. Incidentally, this is perhaps my favorite song in the world to sing when I've had a few beers, although my baritone is slightly less impressive than Stan's. His description of the song starts at 29:46.
2. Footage of Stan singing the chorus to Northwest Passage. I had never heard this song until graduate school, when a Canadian friend played it for me. Now it is one of my favorites. I probably listened to it 30 times on the drive east from grad school. This is right at the beginning of the film.
3. And the best part, the last 5 minutes or so, with the concert footage of Stan singing The Mary Ellen Carter interlaced with footage of Bob Custick describing the wreck of the Marine Electric and how the refrain from the song helped him live through a freezing night in a lifeboat. Seriously, you can't make that up. It is itself the perfect story for a Stan Rogers song. The refrain from this song, and the last lyrics ("smiling bastards lying to you every where you go") has always been one of my favorites. This part starts at the 38:08 mark.
4. How striking bald men with beards are, truly a great look.
I've been a big Stan Rogers fan since my sophomore year in college. I'd never heard of him growing up, but my undergraduate adviser had a tape of a Stan Rogers album he played once on a field trip. For some reason I became hooked. This was 1995, and after fruitlessly searching the record stores in Madison AND Berkeley (the two hippest places I visited that year), eventually found and bought my first Stan Rogers album (Between the Breaks, Live!) using some early online version of a music store. I forget the name, but I remember printing off an order form, mailing off a check, and then 3 weeks later getting two copies in the mail (one as a present for my brother.) I played and replayed this album hundreds of times; on field trips, in my dorm room, on the plane flights back to California to visit family, everywhere. After college, I found a few more Stan Rogers albums at Amoeba Music (Home in Halifax and From Fresh Water), and then later in grad school got a hold of Northwest Passage. Stan died long before I was aware of his music, when I was 7 actually, but I am still catching up with his catalog. Part of this has been the relative difficulty of finding his albums in the U.S., and always being on a budget entirely incompatible with buying import CD's. I've slowly accumulated albums, and a biography, but have never had a chance to see the CBC documentary about his life. Most of the facts in the documentary are things I knew, but what really fired me up was the live footage of him singing, especially the chorus to Northwest Passage. My two favorite albums of his are live albums (Between the Breaks, Live and Home in Halifax), but I'd never seen him perform.
I like all kinds of music, but I can rarely explain why. Stan Rogers is no exception. I have no experience with the activities he sings about (sailing, fishing, farming, etc...), and I am not Canadian (although I have a definite wanna-be Canadian streak). For whatever reason though, his songs truly resonate with me. That actually makes sense, because Stan wasn't any of those things either, well, except Canadian. But somehow he was able to embody peoples lives in his songs, and the ideas and emotions he sings about are pretty universal. Truth is when the weather turns a little foul, there is nothing better than his music.
My favorite parts of this movie are:
1. Stan and friends sitting around a kitchen table stomping and singing his most famous and song, Barret's Privateers. Incidentally, this is perhaps my favorite song in the world to sing when I've had a few beers, although my baritone is slightly less impressive than Stan's. His description of the song starts at 29:46.
2. Footage of Stan singing the chorus to Northwest Passage. I had never heard this song until graduate school, when a Canadian friend played it for me. Now it is one of my favorites. I probably listened to it 30 times on the drive east from grad school. This is right at the beginning of the film.
3. And the best part, the last 5 minutes or so, with the concert footage of Stan singing The Mary Ellen Carter interlaced with footage of Bob Custick describing the wreck of the Marine Electric and how the refrain from the song helped him live through a freezing night in a lifeboat. Seriously, you can't make that up. It is itself the perfect story for a Stan Rogers song. The refrain from this song, and the last lyrics ("smiling bastards lying to you every where you go") has always been one of my favorites. This part starts at the 38:08 mark.
4. How striking bald men with beards are, truly a great look.
Enjoy.
via videosift.com
via videosift.com
PS - Stan died of smoke inhalation in 1983, when the plane he was on (Air Canada 797) caught fire. It was this air disaster that led to the mandatory installment of floor lighting and other guides to help guide passengers in smoke-filled planes to exits. So, every time you fly and the staff are going over the safety features of the plane you are on, think of Stan.
Monday, January 14, 2008
Closure Temperature
I've alluded in some of my previous posts (aquí und hier) to one of the fundamental concepts of thermochronology, the idea of a closure temperature. Today I ended up re-reading some of the first thermochronology papers I ever read, back in the day. Long story short I was thinking about what the term closure temperature means today, and decided that after a year of blogging it was high time the the world's foremost thermochronology blog did something with this fundamental idea.
Most people trace the idea of a closure temperature, or at least the term, to a classic 1973 paper written by Martin Dodson (Dodson, 1973). The issue, as Dodson describes, is that some radioactive daughter products (he was concerned with Sr and Ar, but this also applies to other daughter products) are mobile long after a rock has crystallized. By mobile, I mean that they can readily move out of a crystal. If the daughter products are lost, there is no way to calculate a radiometric age. Well, I take that back, you would calculate an age of zero. Once a mineral cools enough, then the daughter product can accumulate, and the radiometric "clock" has started. Before I go on, I will make another self reference to a post where I point out that OG, Original Geochronologist R.J. Strutt mentioned this problem a century ago. OK, that's done.
It would be nice if this transitional temperature were finite. That is, that there was a set and known temperature above which the daughter product diffused readily, and below which the daughter product is entirely retained. This theoretical temperature is called the closure temperature (usually written as Tc); the temperature below which the mineral is closed to diffusion (in the past few years I've noticed this called a Dodsonian closure temperature, in part recognizing Dodson's contribution but also recognizing the necessary simplifying assumptions his 1973 paper made, more on that in the next paragraph.) In the real world, however, there is actually a broad range of temperatures over which daughter products can, and do, diffuse. This range of temperatures is often referred to as a partial retention zone.
When you start trying to pin down exactly what that means, physically, it gets tricky. The truth is, things like Ar and He never really stop diffusing out of crystals. Even at room temperature, for example, Ar and He diffuse, just so slowly that it really doesn't make much of a difference. Dodson of course realized this, and provides a very zen definition of what he thinks the term closure temperature means:

Most people trace the idea of a closure temperature, or at least the term, to a classic 1973 paper written by Martin Dodson (Dodson, 1973). The issue, as Dodson describes, is that some radioactive daughter products (he was concerned with Sr and Ar, but this also applies to other daughter products) are mobile long after a rock has crystallized. By mobile, I mean that they can readily move out of a crystal. If the daughter products are lost, there is no way to calculate a radiometric age. Well, I take that back, you would calculate an age of zero. Once a mineral cools enough, then the daughter product can accumulate, and the radiometric "clock" has started. Before I go on, I will make another self reference to a post where I point out that OG, Original Geochronologist R.J. Strutt mentioned this problem a century ago. OK, that's done.
It would be nice if this transitional temperature were finite. That is, that there was a set and known temperature above which the daughter product diffused readily, and below which the daughter product is entirely retained. This theoretical temperature is called the closure temperature (usually written as Tc); the temperature below which the mineral is closed to diffusion (in the past few years I've noticed this called a Dodsonian closure temperature, in part recognizing Dodson's contribution but also recognizing the necessary simplifying assumptions his 1973 paper made, more on that in the next paragraph.) In the real world, however, there is actually a broad range of temperatures over which daughter products can, and do, diffuse. This range of temperatures is often referred to as a partial retention zone.
When you start trying to pin down exactly what that means, physically, it gets tricky. The truth is, things like Ar and He never really stop diffusing out of crystals. Even at room temperature, for example, Ar and He diffuse, just so slowly that it really doesn't make much of a difference. Dodson of course realized this, and provides a very zen definition of what he thinks the term closure temperature means:
Closure temperature of a geochronological system may be defined as its temperature at the time corresponding to its apparent age.
So you see, grasshopper, it is what it was. This of course gives no direct way to assign a temperature to an age. Dodson showed the idea graphically this way:

The top graph shows the thermal history of a sample, in the form of temperature decreasing with time. The bottom graph shows the daughter to parent ratio of the sample over the same time interval, with the assumption that at high temperatures the daughter escapes easily, so the ratio is zero. At some temperature, daughters start to be retained, and as cooling continues, the daughter/parent ratio increases with time. If you use the present day ratio to calculate an age, and then see what temperature the rock was at at that time, well, that is the closure temperature of your system. Unfortunately, as I'll talk about in a bit, rocks don't come with the top graph, or even the bottom one for that matter, all we have is the present day daughter to parent ratio.

The best description I've ever heard of a closure temperature was when I was in grad school, a visiting über-thermochronologist said that a closure temperature is really just thermodynamic shorthand for a whole suite of physical and chemical properties. In the equation above, R is the gas constant, Ea is the activation energy of the daughter product's diffusion in the mineral of interest, A is a geometric factor considering the shape of the host mineral the daughter is diffusing out of, Do is the frequency factor (another diffusive constant describing the rate the daughter product), a is the size of the diffusion domain in the mineral of interest, and dT/dt is the cooling rate. Do and Ea are things that are determined through laboratory diffusion experiments, A and a are specified depending on the situation. I'd like to point out a few things about the equation. First, of all the inputs, Ea is the strongest control on the closure temperature; the other variables are locked up in a natural log term. Second, you have to input a cooling rate. But how do you know the cooling rate without thermochronologic ages and closure temperatures? Laboratory measurements of of the diffusive parameters are actually pretty good, but assigning a closure temperature to a system (say He in apatite, or Ar in biotite) still requires knowing a priori the cooling rate. In practice, people often quote a closure temperature assuming an average cooling rate, which is almost as meaningless as saying average geothermal gradient, and which should read geologically reasonable cooling rate (just like it should be a geologically reasonable geothermal gradient,) but I digress. In truth, for a wide range of geologically reasonable cooling rates, the range of closure temperatures isn't that great, certainly within an acceptable range of uncertainties for most applications. Where you run into problems are on the extreme slow cooling end of the spectrum. Minerals that cool very slowly can have drastically reduced closure temperatures (some slowly cooled Chinese samples I worked on have apatite He closure temperatures of about 57°C, about 30% lower that the quoted closure temperature of He in apatite.) The situation gets even more tricky, because this definition of a closure temperature, at least the derivation of the equation, assumes cooling that is linear in 1/T (or that in a time versus inverse temperature plot the thermal history is linear.) Dodson explains why he did this in the paper, and why it is a reasonable assumption for the purpose of the paper, but you can probably guess that rocks that have experienced very complex thermal histories that include perhaps prolonged time at moderate temperatures and/or cycles of heating and cooling will not fit this model.
The upshot of all of this, in my opinion, is that by themselves, thermochronologic ages are meaningless. They are non-unique, and therefore just numbers. Assigning meaning to a thermochronologic age requires external constraints, namely a good understanding of the geology of your study area (good maps, cross sections, and tectonic reconstructions) and multiple thermochronologic controls. There are some excellent software packages that allow you to use many different thermochronometers at once to iteratively constrain each other, usually considering many potential variables are deciding what thermal histories are consistent with all of the available data. My personal favorite is Rich Ketcham's HeFTy. But it all really starts with the geology.
Like many complications in science, the problems inherent in assigning a temperature to a thermochronologic age are increasingly being turned into tools savvy thermochronologists can actually use to their advantage. As I've said before, calculating a geochronologic or thermochronologic age is simple and straightforward. Assigning geologic meaning to that age takes time. It turns out that this problem is especially important to the understanding of the "low temperature" thermochronometers. Since these have seen a huge boom in use and importance in the past decade, it is no wonder that the problem of what closure means is
receiving more and more attention.
I hesitated at including this as the final figure, but decided to include it with a few disclaimers. First, these are all approximate range of closure temperatures for common thermochronologic systems assuming cooling rates of ~10-100 °C/My, and, I do not mean to imply that U-Pb zircon has a classic closure temperature, only that Pb is retained in zircon at exceptionally high temepratures, and typically is more reflective of the time of crystallization than of cooling through a specific temperature. Also, deciding what thermal importance to assign to your particular thermochronologic age requires a great deal of thinking, that is, these temperatures are relevant for the kinds of systems and tectonic settings I typically study, not necessarily those you happen to study. For example, if you work in hydrothermally altered areas, all bets are off. That being said.

References, etc..
Dodson, M.H., 1973, Closure Temperature in Cooling Geochronological and Petrological Systems, Contributions to Mineralogy and Petrology, v. 40, pp. 259-274.
And, although it is focused on the 40Ar/39Ar world, Ian McDougall and T. Mark Harrison's excellent book Geochronology and Thermochronology by the 40Ar/39Ar Method (Oxford University Press, 1999) gives an excellent discussion of closure temperatures, their meaning, and their derivation.
Thursday, November 29, 2007
Brett Favre Shrimp Dip
And other search terms Apparent Dip is the #1 Google hit for:
brett favre shrimp dip
electric triscuit disaggregation
severely emotionally disturbed thermochronology
extraneous Ar reservoir
urlacher apparent moses
I found the "brett favre shrimp dip" one from looking at my StatCounter, the rest I came up with sitting here.
brett favre shrimp dip
electric triscuit disaggregation
severely emotionally disturbed thermochronology
extraneous Ar reservoir
urlacher apparent moses
I found the "brett favre shrimp dip" one from looking at my StatCounter, the rest I came up with sitting here.
Wednesday, November 28, 2007
Predicting Science News
Andrew over at About.com (the geology page) posted his fantastic idea for the upcoming Fall AGU meeting. Prior to the meeting he tries to predict what ten research projects presented at AGU would get the most print. That is, which talks or posters would show up in newspapers, magazines, and on-line. He batted an astonishing .900 last meeting (see this for his write-up on the process.) Both the prediction and the post-meeting media analysis can serve as good starting off points for science and society discussion. If I were in a position where I had students, I could also see this as a good way to make the connection between current research and the science page of their local paper.
Andrew is soliciting entries to either be posted on his blog, or linked to from his About.com page. Links are above or in my sidebar.
As a note, I know that most of you when compiling your lists will search through the abstracts for exciting terms like "thermochronology," "k-feldspar MDD modelling," or "apatite (U-Th)/He." For some unknown reason, print media has been slow to pick up on the Thermo-craze, so while I know that those are the stories you all think SHOULD be reported on the most, I'd suggest trying other themes. Someday print media will understand what the rest of the earth science community already knows (low-temperature thermochronology is hot), but for now, things like earthquakes, hazards, and climate change get all the ink.
Andrew is soliciting entries to either be posted on his blog, or linked to from his About.com page. Links are above or in my sidebar.
As a note, I know that most of you when compiling your lists will search through the abstracts for exciting terms like "thermochronology," "k-feldspar MDD modelling," or "apatite (U-Th)/He." For some unknown reason, print media has been slow to pick up on the Thermo-craze, so while I know that those are the stories you all think SHOULD be reported on the most, I'd suggest trying other themes. Someday print media will understand what the rest of the earth science community already knows (low-temperature thermochronology is hot), but for now, things like earthquakes, hazards, and climate change get all the ink.
Friday, November 23, 2007
The outcrop I've been carting around Part 1
For the past year I've been living in the academic equivalent of the penthouse apartment. I was the sole inhabitant of a two-room office; the outer room has two enormous windows looking out over the campus. It is a first floor office, but elevated enough that I have an excellent view. This past week, the postdoc population of my group, and consequently my office, doubled. This is an excellent development on a lot of different levels, one of which is that I actually tend to work better with someone else in the office (well, I am sure there are exceptions to that, but in general it is true.)
So when I moved into the office, I had way more space than I needed. Consequently my crap kind of exploded all over the place. My rock collection was no exception. I ended up having them all piled on the heating grate under the window. This served double duty, not only was it a place to pile the rocks but it also helped regulate the air, which in the winter is set at "Thermochronic total fusion", and in the summer "Cryogenic cold trap."
So I had to rearrange all of the crap in my office, including the rocks. I've decided to photograph and post about some of my favorites.
First, I want to draw a distinction between my rock collection and my sample collection. I've been collecting rocks since my first Introductory Geology field trip (heh, some of those first Wisconsin Ordovician dolomites and glacial erratics are still in a bucket in my parent's garage.) Rocks in my collection were all picked up on field trips, during field work, while hiking, plus a few gifts. I rarely took very good notes on the samples when I picked them up, or if I did the notes are long gone. This was especially a problem early in my career as a geologist, I've been trying to work on it, but the end result is I have a lot of rocks with vague pedigrees.
Samples, on the other hand, I could take back to their place of origin and more than likely put them exactly where they came from. Samples all have GPS coordinates, they are marked on maps, and I have pictures of the outcrops before and after sampling. Why I can't replicate that for random rocks I pick up I have no idea.
So I moved all of my collection over to my side of the window, it is a little more compact, but I think it still works. Notice how I am covering up about a third of the air vent.

Today's sample is one of my personal favorites. It is something I picked up during my first year in graduate school, when I was a field assistant for my office-mate. Incidentally, Clastic Detritus provided the original inspiration for putting this rock on a post. (And, as a general inspiration, Loose Baggy Monsters recent post about her desk also inspired me to both clean and post a general shot of my workspace. Unlike her post, however, you can actually see my desk in these pictures.) As far as I remember, it is an Early Cambrian shale that I collected along the Transcanadian Highway in eastern British Columbia, just east of Golden B.C., and about as close to the Burgess Shale as you can get on the highway. I remember my office mate telling me we were actually in a late Pre-Cambrian unit, but perusing as many geologic maps as I can find makes me think we were firmly in the Cambrian. I'll hunt some more, but we'll see. Anyways, these are burrow trails in a really old shale. A trace fossil! Our ancestors!


This has always been one of my favorites to show off. Whenever I've participated in people's practice qualifying exams I use this as one of the test rocks. It is amazing how many people want to call it a metamorphic rock, staurolite schist or something.
So more to come, some with better explanations. But I bet that most professional geologists reading this blog have similar piles in their office. Show them off! Let me know and I'll link in this post.
Also, there are outcrops and roadcrops.... so what are these called? Deskcrops? Workcrops? Any suggestions? I am trying to play with the word diamictite, but it is just not working right now.
So when I moved into the office, I had way more space than I needed. Consequently my crap kind of exploded all over the place. My rock collection was no exception. I ended up having them all piled on the heating grate under the window. This served double duty, not only was it a place to pile the rocks but it also helped regulate the air, which in the winter is set at "Thermochronic total fusion", and in the summer "Cryogenic cold trap."
So I had to rearrange all of the crap in my office, including the rocks. I've decided to photograph and post about some of my favorites.
First, I want to draw a distinction between my rock collection and my sample collection. I've been collecting rocks since my first Introductory Geology field trip (heh, some of those first Wisconsin Ordovician dolomites and glacial erratics are still in a bucket in my parent's garage.) Rocks in my collection were all picked up on field trips, during field work, while hiking, plus a few gifts. I rarely took very good notes on the samples when I picked them up, or if I did the notes are long gone. This was especially a problem early in my career as a geologist, I've been trying to work on it, but the end result is I have a lot of rocks with vague pedigrees.
Samples, on the other hand, I could take back to their place of origin and more than likely put them exactly where they came from. Samples all have GPS coordinates, they are marked on maps, and I have pictures of the outcrops before and after sampling. Why I can't replicate that for random rocks I pick up I have no idea.
So I moved all of my collection over to my side of the window, it is a little more compact, but I think it still works. Notice how I am covering up about a third of the air vent.

Today's sample is one of my personal favorites. It is something I picked up during my first year in graduate school, when I was a field assistant for my office-mate. Incidentally, Clastic Detritus provided the original inspiration for putting this rock on a post. (And, as a general inspiration, Loose Baggy Monsters recent post about her desk also inspired me to both clean and post a general shot of my workspace. Unlike her post, however, you can actually see my desk in these pictures.) As far as I remember, it is an Early Cambrian shale that I collected along the Transcanadian Highway in eastern British Columbia, just east of Golden B.C., and about as close to the Burgess Shale as you can get on the highway. I remember my office mate telling me we were actually in a late Pre-Cambrian unit, but perusing as many geologic maps as I can find makes me think we were firmly in the Cambrian. I'll hunt some more, but we'll see. Anyways, these are burrow trails in a really old shale. A trace fossil! Our ancestors!


This has always been one of my favorites to show off. Whenever I've participated in people's practice qualifying exams I use this as one of the test rocks. It is amazing how many people want to call it a metamorphic rock, staurolite schist or something.
So more to come, some with better explanations. But I bet that most professional geologists reading this blog have similar piles in their office. Show them off! Let me know and I'll link in this post.
Also, there are outcrops and roadcrops.... so what are these called? Deskcrops? Workcrops? Any suggestions? I am trying to play with the word diamictite, but it is just not working right now.
Subscribe to:
Posts (Atom)

