In an effort to reboot and restart my writing, I've decided to move Apparent Dip to a new home. Please join me at my new wordpress site.
http://apparentdip.wordpress.com
Thursday, February 06, 2014


Monday, December 01, 2008
The Times about time: Geochronology themed article in the NY Times
 No real analysis here, but I'd like to draw your attention to this recent article by Kenneth Chang in the New York Times about recent work that might shed light on the very early earth. I am highlighting the article both because it deals with geochronology (U-Pb zircon geochronology to be exact), and because it is a rare article dealing explicitly with geology; not modern climate change or some geoscience themed hazard, but straight up geology. The article also has some good quotes from some of the grand high mucky mucks of geology including Mark Harrison, John Valley, and Norm Sleep. I've seen a talk version of some of this data before, and when I get into my office tomorrow I'll check out the Nature paper as well and try to comment, although in all honesty I seriously doubt I'd come up with much more insightful than Professors Harrison, Valley, Sleep, and Mojzsis.
In consideration of self promotion, if you'd like some background on geochronology to help with the NY Times article, check out this earlier post of mine, or any of the background geology posts I have listed on my sidebar.
Tuesday, November 04, 2008
President Elect Barack Obama!
Apparent Dip is thrilled and profoundly happy to announce that my endorsement of Barack Obama for president appears to have worked, tipping the balance in crucial states, and leading to an overwhelming victory for Barack Obama.
I am unfortunately listening to television pundits try to sound profound right now. John McCain gave a fantastic concession speech, I am glad he did not speak like that during the campaign, I feel the contest would have been much closer.
Time to watch his acceptance speech!
I am unfortunately listening to television pundits try to sound profound right now. John McCain gave a fantastic concession speech, I am glad he did not speak like that during the campaign, I feel the contest would have been much closer.
Time to watch his acceptance speech!
Sunday, November 02, 2008
Thermochronologists for Obama
 The wait is over. All across the country, undecided voters have been waiting by their televisions, constantly checking email, listening non-stop to NPR, just to learn which presidential candidate has earned the Apparent Dip seal of approval. I know how much sway my choice has, believe me, as the author of the world's leading thermochronology themed blog...well, let's just say the responsibility has weighed heavily on my (figurative) shoulders.
Apparent Dip is officially endorsing the Obama/Biden ticket. No big surprise perhaps. As someone who reads books, did well in school, and grew up in California, I obviously don't belong to the "real America" I've heard so much about at GOP rallies. I grew up in a decent sized city, which means I lack "small town values" and therefore hate my neighbors, can't stand families, am allergic to hard work, do nothing worthwhile, am a communist, cavort with terrorists, and of course, want America to fail. I am also an elitist because I think issues are complicated and can't always be summed up as one-liners, oh, and I also enjoy reading and non-motorized outdoor activities, which means I am a whiny liberal tree-hugger. Oh, and I don't believe that the term "mothers health" should be put in air quotes or muttered in a snide tone. I care a great deal about my mother's health, and don't consider that an extreme position.
On the issues, well, this seems to be a no brainer. I can't think of a single thing that has gone well in the Bush administration, and McCain agreed with Bush 90% of the time. Right now, the university I work at has a football team that has had a rough few years. Really rough, no bowl games, no winning seasons, no big crowds, embarrassing losses, you know what I mean. Much of the blame is laid at the feet of the coach. Would a fan of this team want to replace the coach with someone who thought he did 90% of everything right? Of course not.
Add to this the fact that for the first time in my life, I have been inspired by a politician. Now, I don't agree with everything Obama is proposing, and I understand the realities of politics, I know many of his plans will be difficult to enact. They always are. What gives me hope though, is that Obama recognizes and acknowledges that issues are complicated. Obama has even spoken about what a huge problem anti-intellectualism is in America today. Seriously, a politician who isn't pretending to be a doofus. A politician who thinks it is important to be more than a guy "you can have a beer with." You know what guys who you can have a beer with are good for? Having a beer with.
On a serious thermochronology note, McCain and Palin have both made offensively ignorant and anti-scientific statements recently. They both love to rail against government spending on research, even when it is obvious that they have no idea what the research is really for. Remember Palin's rant about fruit fly funding? I'm no geneticist, but anyone who has stayed awake through a college biology course knows the importance of fruit flies in genetics research. And guess what, the research Palin was slamming actually is involved with treating children's autism. In one of the debates, McCain brought up DNA research on grizzly bears as a waste of money. Turns out that is the most effective way to understand their population and therefore enforce the endangered species act. But hey, who cares? This also came up a few years ago, when I heard McCain ranting about funding to study "cow farts." The research was actually about methane, a potent greenhouse gas, much of which happens to come from cows. But hey, as long as you can reduce serious science down to a funny one-liner, it must be a waste of money. Not a good use of funds like the Iraq war. To be fair, I don't expect McCain and Palin to know all the science. I do, however, expect them to consult with scientists on scientific issues, which from their statements they apparently do not. And to boot, Palin is a proponent of teaching creationism (excuse me, I mean incompetent design) in public schools, a sure fire way to undermine science. If someone wanted to destroy America's ability to compete scientifically in the future I believe they'd favor the same programs.
I could go on, and it would become more rantish. Long story short, the world's leading thermochronology blog is officially endorsing the Obama/Biden ticket for the 2008 presidential election. I care too much about the future of the country, despite my status as a fake american elitist. Don't forget to vote!
Tuesday, October 28, 2008
Events
On Saturday night a close friend and colleague was hit and killed while riding his bicycle in a park near campus. Alec Waggoner was a 23 year old masters student working in our group, a Kansas native with a bright and promising future. I could go on for pages about Al's scientific and academic ability, but it is his friendship and entirely genuine and unique take on life that I will miss the most. Alec was good at life, and was someone who I admired immensely. His passing can only be described as a monumental tragedy. Many of us have lost a great and true friend, and the earth science community has lost a bright and motivated young talent.
I do not have any experience writing about young friends in the past tense. I will probably write more about Alec later, but not now. My heart and thoughts go out to Al's family.
A few years ago, I read Antoine de Saint Exupéry's autobiographical book Wind, Sand, and Stars. I initially read it because it was listed inthe National Geographic list of the 100 greatest adventure books of all time. When I started reading the book I was initially kind of disappointed. Truth is there isn't a great deal of adventure in the book, especially in the beginning. It is much more philosophical than I was expecting. By the end though, I was really into it, and I ended up re-reading it many times. I often find myself thinking about certain passages, especially during difficult times. This is the one that has been in my head ever since I heard about Alec.
Bit by bit, nevertheless, it comes over us that we shall never again hear the laughter of our friend, that this one garden is forever locked against us. And at that moment begins our true mourning, which, though it may not be rending, is yet a little bitter. For nothing, in truth, can replace that companion. Old friends cannot be created out of hand. Nothing can match the treasure of common memories, of trials endured together, of quarrels and reconciliations and generous emotions. It is idle, having planted an acorn in the morning, to expect that afternoon to sit in the shade of the oak.
So life goes on. For years we plant the seed, we feel ourselves rich; and then come other years when time does its work and our plantation is made sparse and thin. One by one, our comrades slip away, deprive us of their shade.
Monday, October 20, 2008
FT2008 - Alaska chapter 4 and a big thanks

Before I write any more about FT2008, the International Conference on Thermochronometry, I need to take care of one blog related item. Last week I was named a "blog of note" on blogger.com, and have since seen a drastic increase in my readership. Above is a bar graph of my daily page loads from 10/10/2008 until today. Take the statistics challenge, see if you can tell what day I was named a blog of note. I removed the actual numbers, well, mainly because I have been shamed into realizing I was letting my blog suffer tremendously and therefore are unwilling to admit my average readership. But, thanks to the recognition, my page loads really spiked, that first day they were 2 orders of magnitude higher than average, and although they have settled down, are still 20 times what I am used to. Now, based on the comments, many people want to attribute this to my pretty pictures from Alaska, but that is probably only because they are embarrassed to admit how addictive thermochronology can be. I understand gentle readers, but don't be ashamed, it is OK to admit that you are fascinated by thermochronology, that you now want to quit your career and pursue this new passion, that you now try to work in the phrase "thermally activated volume diffusion" into everyday conversations, and you are constantly frustrated when reviewing papers that compare apparently phase-independent "40Ar/39 ages" to U-Pb zircon ages like they are the same thing.
Seriously though, thank you to whoever named me a blog of note, and to all of the people who've had so many nice things to say about the blog and my pictures. I appreciate the kind words.
So back to FT2008, the International Conference on Thermochronmetry. In a previous post, I discussed some of the methodoligical advancements I was most interested in. Today I just wanted to highlight a few of the case studies I found most intriguing. Again, if you are interested in these topics, make sure to check out the free and downloadable extended abstracts from the meeting, available from the Union College FT2008 website. Of course, these will be interspersed with random pictures from the field trips, in no particular order.

- There was one talk and a few posters that dealt with apatite fission-track and (U-Th)/He ages from tunnels in the alps. The talk was by Reinecker, and I apologize for not remembering his first name, and the posters were by Glotzbach and Spiegel. All of these papers were in the Alpine Orogen session on the Thursday of the talk. So why tunnels? Well, these tunnels go straight through significant topographic peaks. Isotherms, or surfaces of equal temperature in the earth, tend to mimic topography, especially at relatively shallow levels. In some ways this is a problem in thermochronology. We often would like to know how fast things came to the surface, but that depends on the depth of the closure temperature isotherm, which in turn depends on toppgraphy (and many other things), which we don't necessarily know. Isotherms are deflected up under large topographic peaks, meaning that if you drill sideways through a mountain, you will experience hotter and hotter temperatures towards the core of the mountain. So I mentioned that the deflection of isotherms is a problem for us brave thermochronologists, but used correctly, it could also be a relatively powerful tool. If topography can affect isotherms, then topography should also be recorded in thermochronometers. The tunnel studies should see evidence for the topography being recorded in the low-temperature thermochronometers. Turns out it isn't so obvious, but I'll leave the abstracts for you to read.


A Blue Grouse (I think, correct me if I am wrong)
- In the last few years there have been a number of studies investigating the link between climate and tectonics. Specifically, which drives which? My own personal belief is that it just isn't an either or, but the idea that climate (namely erosion) could drive crustal processes is kind of hard to swallow for many geologists. Some of the evidence for this involves correlations between erosion rates, rainfall, and uplift rates in active mountain belts. This isn't supposed to work everywhere, there are plenty of places that get tons of rain but where nothing is being uplifted (like the Amazon basin), but many people think of it as a major driver in mountainous regions. Frank Lisker presented a paper on some of his results from Sri Lanka, and what struck me is that the southern part of the island has a rather large mountain (2000+ meters) and gets buckets of rain, but has i n c r e d i b a l l y s l o w uplift rates, slow enough they are reported in meters per million years (typically we report uplift rates in kilometers per million years).
 More massive piles of Late Miocene - Pliocene conglomerates
So I think that is all I'm going to write on this. It gets difficult to decide what talks to highlight and what talks not to highlight. If you have found any of the things I've discussed intriguing, download and enjoy the abstract volume.
 More pillow basalts from the Kenai Peninsula. Seriously, they actually look like pillows!
 And my last Alaskan fall picture
Thursday, October 16, 2008
FT2008 - Alaska chapter 3 - Alaskan Wildlife
So no geology this post, but instead I thought I'd post some of the wildlife pictures I took on the Denali and Kenai Peninsula field trips. First from the Kenai peninsula fjords cruise, some Stellar Sea Lions, hanging out on pillow basalts. I guess I lied, I said no geology, and here I am tossing around the term pillow basalts. This species is endangered, and if you look at the guy in the center, you can see he has a numbered brand. The decline in sea lion population is a little confusing, allegedly, and the tatoos help track them throughout their range. The pillow basalts, while not endangered, are still fantastic. This cruise actually included some of the best pillow basalt exposures I've ever seen firsthand.
 Next up, a black bear! To attempt to head off any scolding comments or emails, I did not approach this bear. I was walking down a path when I came on a student who had stopped. She had been there for a few seconds. She had walked around a corner, and a youngish black bear had seen her and ran into a tree. I had my camera out, snapped this picture, and quietly walked away, trying not to attract anyone else down the walkway.
 What would Alaska be without a moose? What this picture doesn't show is the other 50 people on the side of the road snapping pictures of this moose.
 I took this last picture for my Mom, just to say that we did not see any of the famous Alaskan "chikens" on the trip.

Enjoy!
Tuesday, October 14, 2008
FT2008 - Alaska chapter 2

As I mentioned in my last post, the scientific program at FT2008 (The International Conference on Thermochronometry in Anchorage) was overall pretty impressive. I thought I'd highlight a few of the presentations that I found most interesting. As a side note, the extended abstracts for this meeting can be downloaded for free from the official meeting website here. The abstracts vary in length, but most are true extended abstracts with color figures. My discussion is by no means exhaustive, and who knows, I might augment it later. Here are some of my highlights, interspersed with random pictures of mine from the field trips. I am primarily sticking to methodological highlights today, I'll save the others for later posts.
- There were many discussions and presentations by one of the meeting sponsors, Autoscan. Autoscan is an Australian company that has been working to develop an automated fission-track counting system. I am still in the early stages of learning to count tracks, but I've observed the process and know most of the basics. Counting fission tracks is exactly what it sounds like, fission-tracks are etched in acid, and then using a microscope you count the number of tracks in your grain (gross oversimplification, I know, but to make a point). So counting tracks can be tedious, you need to count hundreds of them from dozens of grains to beef up your statistics. Anyways, as nice as it would be to have an automated counting system, the mechanics and potential complications of the process make me wary of trusting an algorithm. That being said, the Autoscan demonstrations are pretty convincing. You can download the demonstration and demo images from the Autoscan website here. Andy Gleadow gave the presentations on Autoscan and led the discussions. He went into detail about how the software deals with some of the more specific problems, comparing reflected and transmitted light images, evaluating overlapping tracks, distinguishing tracks from scratches and dust, etc. By the end I was sold. Again, I am not a certified fission track counter [yet], and therefore am undoubtably missing some important caveats, but Autoscan impresses me.

- Speaking of fission-tracks, there were another set of talks and posters by the group from Union College/SUNY Albany (John Garver and his student Matt Montario) about their recent work using a scanning electron microscope to date high track density zircon samples. The problem is this: Fission-track dating works because with time, tracks form in U-bearing minerals due to the spontaneous fission of 238U. Old and/or U-rich samples can accumulate so many tracks that they become impossible to count; they overlap and obscure each other too much. The Union/Albany group has developed techniques that allow them to count very high density samples. They do this by using a modified etchant (super secret recipe, well, until they get it published that is) and a scanning electron microscope. Typically, fission-tracks are etched with acid so they become large enough to see with an optical microscope. But, if you have a lot of tracks, this is a problem. So by using a less aggressive etchant, and more powerful microscope, they are able to effectively count samples that would otherwise be useless. I am assuming this will all be published soon, so I'll keep you updated.
- Barry Kohn presented some work he has been doing attempting to reduce single-grain apatite (U-Th)/He age spread in quickly cooled samples. Apatite (U-Th)/He thermochronology has been in widespread use for a little over a decade now, and as more and more data sets are collected, we are starting to identify and grapple with recurring problems. Perhaps the most significant issue are irreproducible single-grain ages. These are samples that appear well-suited for analysis, and have easily measurable quantities of U, Th, Sm, and He. Despite this, it is not uncommon for grains from the same hand sample to show significant scatter, well beyond what you'd expect from simple analytical uncertainty. There are many reasons why you'd actually expect significant single-grain scatter in slowly cooled samples. I won't go into it, but instead refer you to Fitzgerald et al., (2006) for a review. For quickly cooled samples, however, there shouldn't be as many complicating factors. Kohn presented results from his experiments where grains are abraded prior to analysis. Air-abrasion removes the outer rind of the crystals, leaving just a rounded core. Air-abrasion has the potential to deal with the "bad neighbor" problem in apatite (U-Th)/He thermochronology. "Bad neighbors" are U, Th, and/or Sm bearing phases that are close to or in contact with the apatite crystal in the rock. Because the He atoms move about 20 microns or so when they are expelled from their parent atom, He produced in neighboring phases can be implanted into the apatite. You end up with "parentless" He, which gives you artificially old ages. So, the idea is that if you abrade off the rind, you remove the region that could have had "parentless" He implanted into it. Kohn isn't trying to say that this is the only answer or that it always works, but in some of the samples he analyzed it certainly had the desired effect. Namely, abraded grains showed less scatter and were more consistent with fission-track ages and/or other constraints. Obviously still a lot of work to be done, but again, very intriguing.

So those are some of the presentations I have thought about the most since I got back from Alaska. I'll have more highlights in later posts. I'll also have more pictures, including a special Alaskan wildlife post, and a brief discussion of our stop at the Wasilla town hall. Yes, we stopped in Wasilla. But before I leave, here is a picture I took of the Exit Glacier, I tried to get the glacial striae in the foreground with the big looming wall o' ice in the background. Unfortunately I couldn't Photoshop out the guard rope and warning sign.

Fitzgerald, P. G., S. L. Baldwin, L. E. Webb, and P. B. O'Sullivan (2006), Interpretation of (U-Th)/He single grain ages from slowly cooled crustal terranes: A case study from the Transantarctic Mountains of southern Victoria Land, Chemical Geology, 225, 91-120.
Wednesday, September 24, 2008
FT2008 - Alaska chapter 1
 There are many potential reasons why the world's leading thermochronology blog has been utterly silent for the past few months. This has nothing to do with the world of thermochronology, which as I'll discuss in a bit is as cutting edge and fast paced as ever. No, this has more to do with the authors life, motivation, and workload. I am attempting re-entry, this time with the proper heat sheild as to avoid blog burn up. The score so far, sense 0, tangential metaphors 1.
I am going to report on last week's International Thermochronology Conference (called FT2008 as a remnant of the meeting's origin as a fission-track conference), probably in installments of some kind. This was my first "specialist" type conference, which I have to say is a great idea. First off, I was interested in all of the talks and posters. This of course never happens at large conferences. Well, to be fair, I might find all of the presentations at AGU or GSA interesting if I was an expert/aficionado in the subject, it is tough to get into things that you just don't get (like cricket). In addition, there was only one session, everyone saw every talk and had time to go to every poster session. No dog-eared copy of the program or guestimates of if you can make it to the next room in 2 minutes. No, once set your were firmly planted in the session. There were enough coffee and poster breaks that I didn't get meeting sores.
But I think the best part of being at a specialist conference is that it gives the attendees a chance to discuss things that wouldn't really fit at AGU, GSA, EGU, or even a Goldschmidt (although to be fair I haven't attended the latter two). We all have issues with data collection, analysis and reduction, modeling, and/or consistency. We as a community have specific techniques, or aspects of specific techniques we are still trying to make sense of. And, we are all interested in new developments in the hardware and software we use every day. These things just don't make most large conferences. These things came up all the time at FT2008, both in the formal sessions, as well as over beers later on.
Not that it was all songbirds and sunshine. There were a fair number of talks that were just not that great. Like a soufflé, thermochronology is something that it is easy to F-up; in the field, lab, or at your computer. There were too many talks where I got the feeling the author had never read many thermochronology papers. This isn't much of an exaggeration, I'd say one of the most glaring errors involved ignoring (sometimes landmark) previous work from the same field area. Usually though it had to do with the study design and sampling strategy, or interpretation.
But today I'm going to talk briefly (read: show pictures) about the pre-meeting field trip. This was my first trip to Alaska, and I was very lucky to get in on the 2.5 day trip north to Denali. The trip included about 40 people, faculty, students, and even some industry and government folks. The trip covered a lot of different topics, and was for most of us an introduction to the geology of South Central Alaska.
This may seem obvious, but the trip really reinforced to me the enormity of Alaska, and the complexity of Alaskan geology. The area we discussed was larger than some states. Exposure is not ideal, neither is access. And, like many areas that are still active, there are generations of structures and events that are continually being modified and obscured.
As far as rocks go, most of the features we saw were large overview things, the trace of the Denali and Castle Valley Faults, some of the different large mountain belts, features from the 1964 earthquake, etc. We did see some excellent exposures of some of the ginormous piles of conglomerates shed off the various mountain ranges. I make no pretense of being a sedimentologist, but even these had me impressed.
The weather hid most of the dramatic views on the first day, but we did have this one fantastic view of Denali from the park road.

We were also smack dab in the middle of the fall colors coming out. This is a picture I took from Honolulu Creek, one of the exposures of these piles of late Miocene-Pliocene conglomerates we spent some time arguing about. The exact age of the deposits isn't too well constrained, but they are believed to be correlative to the Pliocene Nenana gravels. The Nenana gravels are interpreted by the field trip leaders to result from the unroofing of the Alaska Range.

The meeting included some talks I'll hopefully post about that discuss some of the more recent thermochronology in this part of Alaska. We did talk a great deal about one of the more "landmark" thermochronology papers that happens to come from this area, which focused on an elevation transect all the way up Mount Denali (see Fitzgerald et al., 1995; the top of the fossil apatite fission-track partial annealing zone is at about 3800m).
More later, I bought some sourdough starter while there and now need to go attend to loaves.
Fitzgerald, P.G., Stump, E., and Redfield, T. F., 1993, Late Cenozoic uplift of Denali (Mt. McKinley) and its relation to relative plate motion and fault morphology, Science, v. 259, p. 497-499.
Monday, June 30, 2008
SoCal Shakeout 2008

When I TA'd introductory geology for my adviser, he'd always have an assignment early in the course that focused on earthquake safety. My graduate school was in Northern California (read "the chosen land"), in an area that straddles one of the most famous faults in the world, and has experienced many destructive historical earthquakes. The assignment was simple; he told the students to go back to their dorm room and do one thing that would make them safer during the next earthquake. They didn't have to turn anything in, but after a week he'd ask for a show of hands to see how many people followed through. Participation was minimal, to say the least. Those people that did raise their hands put in less-than-impressive effort. No one made an earthquake kit (bottled water, batteries, non-perishable food, diet coke, etc..), and just a few removed heavy things from above their bed or double checked their emergency exits. I was even surprised how few graduate students, fellow geologists had proper earthquake kits. I had one, never had to use it, but it took a total of 20 minutes and about $10 to put together.
This is all a preamble to advertise what appears to be a fantastic earthquake preparedness event that I was told about this afternoon. It is called the Great Southern California ShakeOut. The ShakeOut is a series of events that focus on preparing Southern Californians (read "heartless water-stealers") for the inevitable; the next big quake. The ShakeOut has both a blog and official website, and culminates in the largest planned earthquake drill ever in the history of the known universe, on November 13th 2008 at 10 am. Now, I proudly hail from the cultural, intellectual, and political capital of California. I spent graduate school in Northern California, where folks in L.A.L.A.Land get most of their water. Needless to say I have many beefs with the ne'er-do-well neighbors to the south, but I can give the ShakeOut event nothing but support. Contrary to some reports, Southern California is not all bad, and the fact that they are putting so much effort and energy into what is essentially geoscience education and public outreach can make me even [temporarily] forget the 2002 NBA playoffs (also here and here). They also have a great motto on the blog, "because shift happens."
So check out the sites, and if you live in Southern California, get ready for the Big One!
Thursday, June 26, 2008
Zotero and Citation Managing
Like many paper-writing academic types, I typically employ a haphazard and ill-planned technique for reference-handling when writing papers. I have EndNote and BibTeX, and I have used them both at times, but I really have never been entirely satisfied. I have liked EndNote at times, but the truth is the version I have is old and clunky, and I am not all that thrilled about plunging another $100 some-odd dollars into an updated version. BibTeX was great while I was using LaTeX, but most earth science journals do not accept LaTeX file submissions, and none of my collaborators are ever comfortable with LaTeX, which means I have to constantly import and export from Microsoft Word to LaTeX and back. A pain. Plus, BibTeX is great for most things, but putting out a .rtf formatted bibliography is not one of them. So to summarize, I want something cheap (read: free) that works well with Microsoft Word (the standard for my collaborators).
Enter Loose Baggy Monster, my better half. One of her favorite things in the world is playing with new word processing related software. Seriously, I'm not joking. She is especially excited about reference management utilities and other things that let her release her humanities dorkosity.
She pointed me toward Zotero, a free reference and bibliography management utility that works through FireFox, and integrates beautifully with Word 2004. I've now become a convert, and decided it is time to spread the word. Now, there are many features in Zotero I don't yet use or understand, and I am sure in the future I'll do a better job showing off it's power, but here are some screen shots describing why I like Zotero. Oh, and if you want, click on the pictures to see higher resolution versions.
First off, Zotero makes importing references into your database very easy. I do all of my reference searching on web-based applications, such as my current GeoRef interface (shown below).
You will notice that in the browser address bar, there is a little orange folder. That means that this page has enbedded bibliographic information that Zotero can read, and import directly into your database. This is a GeoRef search for the term "jimboite."
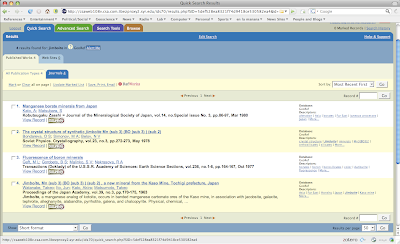
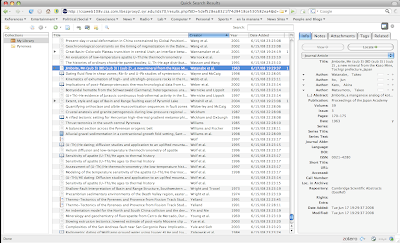
If you click the orange folder, a window appears with all of references that appear on the page. You select which ones you want in your database, and once you click OK that are imported. You can see that there is another window on the bottom right showing the references that are currently being imported.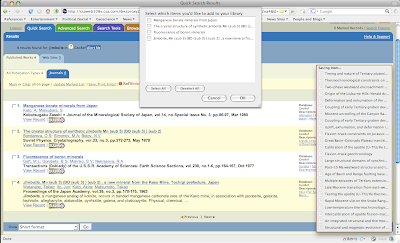 You will also notice that on the bottom of my browser window, there is the little "Zotero" icon. If you click this, you are taken to your personal database. You can see that one of the articles I had searched for and selected in my "jimboite" search is now in my database. I should mention here that this database is held on your hard drive, so even though it runs through a web browser, you don't have to be online to access your downloaded or otherwise entered database. Nor must you be on the interwebs to use the "cite while you write" functionality in Word 2004.
So now lets go to Word and start writing that landmark paper. You can see that because I installed the free Zotero plugin for Word, I have a little Zotero menu bar up on the top of the screen shot. So I've written my first stunning introductory sentence, and now want to insert a reference. I click one of the menu bar buttons.

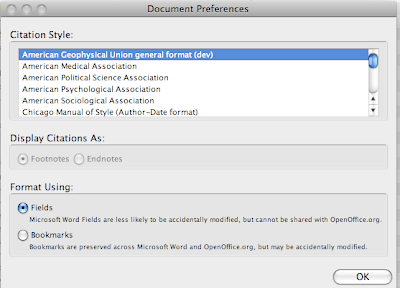
And this window comes up. I can select what citation style I want to use. Truth is there aren't as of yet that many earth science citation styles available, but someone did make the AGU general style, which I tend to like. On the Zotero web site you can download and install the AGU style (it does not come standard), and there is also a style-maker that I have yet to figure out.
After I click AGU, I am then shown a window where I select the reference that I want to include. You can chose one or multiple, either way it is pretty simple.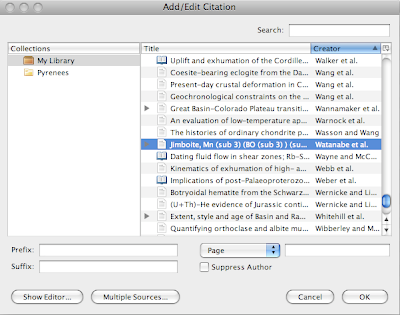
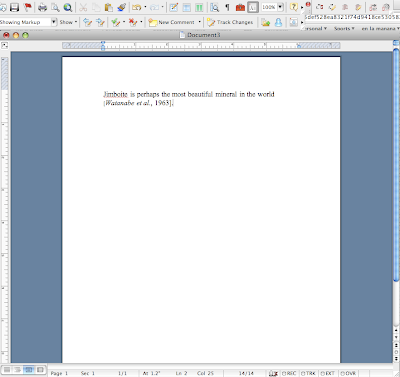
Click "OK" and voila! the paranthetical citation is entered into the word file.
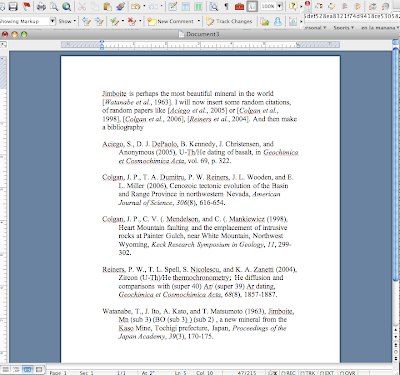
So now I'll add some more text and reference, and then click the menu bar button that says "Zotero Insert Bibliography" and Ka-Bam! Instant formatted bibliography.
Now GeoRef isn't the only web search engine that lets you download references straight away. Most of the individual publisher or journal web pages do as well. There are plenty of other features I like, for example you can take snapshots of web pages if you wish to record and later reference those; you can link references in your database directly to the .pdf's on your hard drive, and so on.
There are some things I want Zotero to improve on. First I'd like more citation styles. Zotero also does not have any decent way to sort out duplicate references, which is a headache. But, Zotero is one of those programs it seems is improving quickly. And hell, it's free!
So as of now I am a convert.
Enter Loose Baggy Monster, my better half. One of her favorite things in the world is playing with new word processing related software. Seriously, I'm not joking. She is especially excited about reference management utilities and other things that let her release her humanities dorkosity.
She pointed me toward Zotero, a free reference and bibliography management utility that works through FireFox, and integrates beautifully with Word 2004. I've now become a convert, and decided it is time to spread the word. Now, there are many features in Zotero I don't yet use or understand, and I am sure in the future I'll do a better job showing off it's power, but here are some screen shots describing why I like Zotero. Oh, and if you want, click on the pictures to see higher resolution versions.
First off, Zotero makes importing references into your database very easy. I do all of my reference searching on web-based applications, such as my current GeoRef interface (shown below).
You will notice that in the browser address bar, there is a little orange folder. That means that this page has enbedded bibliographic information that Zotero can read, and import directly into your database. This is a GeoRef search for the term "jimboite."

If you click the orange folder, a window appears with all of references that appear on the page. You select which ones you want in your database, and once you click OK that are imported. You can see that there is another window on the bottom right showing the references that are currently being imported.
 You will also notice that on the bottom of my browser window, there is the little "Zotero" icon. If you click this, you are taken to your personal database. You can see that one of the articles I had searched for and selected in my "jimboite" search is now in my database. I should mention here that this database is held on your hard drive, so even though it runs through a web browser, you don't have to be online to access your downloaded or otherwise entered database. Nor must you be on the interwebs to use the "cite while you write" functionality in Word 2004.

So now lets go to Word and start writing that landmark paper. You can see that because I installed the free Zotero plugin for Word, I have a little Zotero menu bar up on the top of the screen shot. So I've written my first stunning introductory sentence, and now want to insert a reference. I click one of the menu bar buttons.

And this window comes up. I can select what citation style I want to use. Truth is there aren't as of yet that many earth science citation styles available, but someone did make the AGU general style, which I tend to like. On the Zotero web site you can download and install the AGU style (it does not come standard), and there is also a style-maker that I have yet to figure out.

After I click AGU, I am then shown a window where I select the reference that I want to include. You can chose one or multiple, either way it is pretty simple.

Click "OK" and voila! the paranthetical citation is entered into the word file.

So now I'll add some more text and reference, and then click the menu bar button that says "Zotero Insert Bibliography" and Ka-Bam! Instant formatted bibliography.

Now GeoRef isn't the only web search engine that lets you download references straight away. Most of the individual publisher or journal web pages do as well. There are plenty of other features I like, for example you can take snapshots of web pages if you wish to record and later reference those; you can link references in your database directly to the .pdf's on your hard drive, and so on.
There are some things I want Zotero to improve on. First I'd like more citation styles. Zotero also does not have any decent way to sort out duplicate references, which is a headache. But, Zotero is one of those programs it seems is improving quickly. And hell, it's free!
So as of now I am a convert.
Sunday, June 01, 2008
Brian Greene in the NY Times
The better half and I just returned from vacation this week (contrary to the comment I recently received, the blog break has not been NSF-induced, but rather from an incredible week + vacationing.) I am adjusting to the time and lifestyle change fine, and spent most of the weekend getting back on track (including a few visits to a lab undergoing a bakeout). This morning I ran across this article in the NY Times by Brian Greene (physicist and author of many popular science books.) It starts with a description of a letter he received from a soldier stationed in Iraq, the kind of letter anyone who fancies themselves a writer must be thrilled to receive. He then spends some time discussing the status of science education in the US. As a scientist who is interested in science education, I thought it was worth linking to.
My only beef is that when discussing the issue of science education Green writes:
My only beef is that when discussing the issue of science education Green writes:
It’s much the same story in classes for biology, chemistry and mathematics.
You might notice that once again geology and/or earth science is not given a place on the list of important sciences. I am sure Greene has no problem with geology, that is not what I mean, I just think it is sad how often the "important" sciences are listed off with nary a mention of the science that studies the planet we live on. Other than that, the article is worth a read. He makes the point that science education is "unassailably vertical [paraphrased]" and too often focuses on teaching skills and forgets to involve the grand ideas, the things that might inspire students to want to learn the skills. Or as he writes:
Like a music curriculum that requires its students to practice scales while rarely if ever inspiring them by playing the great masterpieces, this way of teaching science squanders the chance to make students sit up in their chairs and say, “Wow, that’s science?”
This is the second time I've blogged about a prominent scientist somehow appearing in the NY Times and forgetting to include geology as an important science. The first time is here, in an article that quotes nobel laureate Leon Lederman.
Monday, May 12, 2008
Mass Transit
I saw this article in the New York Times today, and thought I'd mention it as a kind of part 2 of my commentary on high gas prices (see my post from a year ago here, although prices have continued to rise I don't think my sentiments have changed a ton). I'll let you read the article yourselves, but the basic synopsis is that with gas prices at all time highs, public transit systems are seeing record breaking ridership. It appears we might be near the "tipping point" where prices are high enough to convince people to train, bus, bike, or walk-it. Of course biking and walking won't show up in these statistics, but you get the point.
The article contained one thing I'd like to quote:
UPDATE, thought I'd add this clip from the 1999 Simpsons season.
The article contained one thing I'd like to quote:
The increase in transit use coincides with other signs that American motorists are beginning to change their driving habits, including buying smaller vehicles. The Energy Department recently predicted that Americans would consume slightly less gasoline this year than last — for the first yearly decline since 1991. [emphasis added]
Think about this. In 1991, I didn't have an email address. I couldn't even type very well. I listened to mix tapes on a Sony walkman (90-minute Maxell XLII tapes of course). MTV still played music, and we would see the release of both Ten and Nevermind that year. Kurt Cobain has now been gone more than a decade, and we have iPods, blogs, the interwebs, and instead of walking to my local record store I download albums from iTunes. But with all of those amazing technological advancements we came up with nothing to make our transportation-related energy use more efficient. In fact, we just kept using more and more. Just think if transportation saw the same step increase in technology that the walkman did. As tough as high oil prices can be for people, how many decades have people been making rational arguments for higher fuel economy, increased public transportation, and decreased dependence on fossil fuels? Just for argument sake, let's say since the late 1970's. And what have we done? If we would have heeded those warnings back then, when gas was $1.25 a gallon, perhaps it never would have reached this point.
Oh, and even with a cheap-o 9 year old car I still pay less for gas now that a medium-sized SUV driver did in 2000.
UPDATE, thought I'd add this clip from the 1999 Simpsons season.
Sunday, May 11, 2008
Mother's Day
Every mother's day I tend to balance my general dislike for the Hallmark Holidays with my overwhelming love, thanks, and appreciation for my mom. My balance usually ends up with me calling her, something I should do more often. While in grad school I was lucky enough to attend a poetry reading by then Poet Laureate Billy Collins. I like Billy Collins a great deal. One of my favorite poems of his is called "The Lanyard."
OK, time to connect the thoughts in the previous paragraph. As Apparent Dip's mother's day offering, I bring you "The Lanyard" by Billy Collins. You can hear him read this here, or on this excellent CD. As a copyright note, I am only putting the text up because NPR did, and I figure if NPR thinks it is OK, then so does Apparent Dip. I think most poems are best listened to, so check out the links above.
OK, time to connect the thoughts in the previous paragraph. As Apparent Dip's mother's day offering, I bring you "The Lanyard" by Billy Collins. You can hear him read this here, or on this excellent CD. As a copyright note, I am only putting the text up because NPR did, and I figure if NPR thinks it is OK, then so does Apparent Dip. I think most poems are best listened to, so check out the links above.
The Lanyard - by Billy Collins
The other day as I was ricocheting slowly
off the pale blue walls of this room,
bouncing from typewriter to piano,
from bookshelf to an envelope lying on the floor,
I found myself in the L section of the dictionary
where my eyes fell upon the word lanyard.
No cookie nibbled by a French novelist
could send one more suddenly into the past --
a past where I sat at a workbench at a camp
by a deep Adirondack lake
learning how to braid thin plastic strips
into a lanyard, a gift for my mother.
I had never seen anyone use a lanyard
or wear one, if that’s what you did with them,
but that did not keep me from crossing
strand over strand again and again
until I had made a boxy
red and white lanyard for my mother.
She gave me life and milk from her breasts,
and I gave her a lanyard.
She nursed me in many a sickroom,
lifted teaspoons of medicine to my lips,
set cold face-cloths on my forehead,
and then led me out into the airy light
and taught me to walk and swim,
and I, in turn, presented her with a lanyard.
Here are thousands of meals, she said,
and here is clothing and a good education.
And here is your lanyard, I replied,
which I made with a little help from a counselor.
Here is a breathing body and a beating heart,
strong legs, bones and teeth,
and two clear eyes to read the world, she whispered,
and here, I said, is the lanyard I made at camp.
And here, I wish to say to her now,
is a smaller gift--not the archaic truth
that you can never repay your mother,
but the rueful admission that when she took
the two-tone lanyard from my hands,
I was as sure as a boy could be
that this useless, worthless thing I wove
out of boredom would be enough to make us even.
Saturday, May 03, 2008
Thermochronologic Sampling
I've posted about thermochronology and mineral separations (twice), but I realized that I haven't yet gone over the field work aspect of thermochronology.
Now, I'll admit up front that the field work I do is not very hard core. There are plenty of thermochronologists who spend months in the classic style, mapping and sampling in some remote part of the planet, I am really not one of them. The most rugged field work I've done was when I was in college, and while the helicopter rides and grizzly bears gave me some geo-street cred, my field work since then has been rather tame. The truth is, as a thermochronologist, you rely on good maps. Your data is meaningless outside of geologic or structural context. Now, it is pretty commong for people doing thermochronology to provide the necessary structural and geologic underpinnings. For much of my work, I've been fortunate enough to work in places that have been mapped very well, and I'm often in field parties with the people who've done the mapping.
Anyways, what I am going to be blogging about assumes you either have or are making the maps necessary for actually understanding your data.
OK, first things first, you can take a thermochronologic sample anywhere there are rocks, but when you plan your sampling, there are some important things to consider.
First, although you can get important information from single samples, the most powerful sampling method involves collecting multiple samples from different structural positions. If cooling and exhumation have been vertical (as is the case with my current project, see this for a more in depth discussion), then this means collecting samples at different elevations. For reasons I'll explain in a later post, it helps to cover as much structural relief as possible without moving too much laterally. The ideal sampling surface in a region with vertical exhumation would be a sheer cliff. In regions like the basin and range, where faults and structures have rotated lithologic units, structural relief might be almost horizontal (like Yerington). Again, this is why you need to already understand your field area.
So lets just say that exhumation has been vertical. Your sampling transect will try to cover the greatest amount of relief possible.
In almost every case, the best lithologies to sample for thermochronology are granites or granodiorites. So to summarize, you are looking for a big granite mountain.
Unless you are attempting some rather specialized analyses, you also want fresh and underformed rocks to sample. Obviously then, avoid altered rocks, weathering varnishes, and rocks that have been faulted or otherwise chewed on. You will also want to avoid the outer few cm's of outcrop because of potential problems caused by forest fires (see Mitchell and Reiners, 2003, Geology v.31, n.12, pp.1025-1028; summary if you don't have access, fires can reset apatites, so don't sample the outer few cm's. They do very interesting things with the data, but I won't go into that right now).
OK, so find your enormous granite mountain made entirely of fresh outcrop (this sounds pipe dreamy, but actually describes some of my current field areas).
So you want to take a whole slew of samples from different elevations. It is pretty standard to sample every 100 meters or so of relief (structural relief or elevation). So, first step, find a place at the right elevation that has fresh outcrop. As below

If the rocks aren't that well exposed or fresh, it helps to spend some quality time with your chisel. I love the ones with the hand guards. If you are sampling granitoids, bring a sledge hammer, not a pick hammer. Sledge hammers (3 or 4 lb head, metal or wood handle) make the job much easier. check out Dr. New Helvetia chiseling away at an oriented sample

If you are interested in mica, hornblende, or K-Feldspar, you usually don't need much sample at all. You can often see the minerals you want to analyze with your hand lens, and can sometimes "field dress" your sample, and take out what you want with your knife (works well especially for books of mica). For apatite, zircon, and monazite, you have a lot more work ahead of you. since the first step in that mineral separation might mean feeding your sample through a jaw crusher, I find it useful to break your sample into bite sized chunks on the outcrop. If you wait to bash up a large sample into smaller pieces back in the lab, you have to spend all kinds of time cleaning up. You don't have to clean up or worry about contamination if you bash things up on the outcrop. Bashing things up also lets you remove the weathered rinds you want to avoid.
Many rocks seem to be either feast or famine when it comes to apatite and zircon abundance. Some rocks I've worked on yield piles and piles of apatite, where I could have gotten away with much less sample. Others yield nothing, and it wouldn't have mattered if I would have brought home a barrel's worth. I usually go for about 3-4 kgs of sample.
So you've now got your mandarin orange sized chunks of amazingly fresh granite, time to bag them. I prefer heavy cloth bags, like those available here at Miners Inc. I don't reuse them, so I label the bajeesus out of the bags with a Sharpie.

I write the sample name, elevation, and some basic info about the geologic context of the sample. I also like to take a picture of the sample bag (with the sample name readable) on the outcrop, kind of a way to help me remember the sample and where I took it. I also take a GPS reading, and plot myself manually on a topographic map. I'll actually check my map location against the GPS whenever possible.
 This is also a good way to trick otherwise camera shy members of a field party to have their picture taken. Again, Dr. New Helvetia.
 Taking pictures like this also helps me keep my photos organized. For example, I'll have pictures like this below, that I don't write a ton about in my field book (because I am an idiot who is still acquiring skills), but I have it sandwiched in between pictures I have GPS coordinates for, so I'm all good. I was able to recreate the outcrop where I saw these enormous K-feldspars, even though it was towards the end of the day and my field notes weren't as complete as they should have been.
The K-feldspars remind me of salmon swinning upstream.
 Now, I usually have a back-and-forth sampling route. Meaning, I'll hike up to the highest point in my field area, take a sample, and then head down, sampling as I go. This saves you from having to carry rocks up hill, which is usually a good thing. I also find it easy to plan time this way. I plan on eating lunch at the highest point, and I know that I can cover ~1300 m of elevation in a day (13 samples) with a good field party (at least 1 other person). You can also note good outcrops on your way up, making the way down more efficient.
Now, I'll admit up front that the field work I do is not very hard core. There are plenty of thermochronologists who spend months in the classic style, mapping and sampling in some remote part of the planet, I am really not one of them. The most rugged field work I've done was when I was in college, and while the helicopter rides and grizzly bears gave me some geo-street cred, my field work since then has been rather tame. The truth is, as a thermochronologist, you rely on good maps. Your data is meaningless outside of geologic or structural context. Now, it is pretty commong for people doing thermochronology to provide the necessary structural and geologic underpinnings. For much of my work, I've been fortunate enough to work in places that have been mapped very well, and I'm often in field parties with the people who've done the mapping.
Anyways, what I am going to be blogging about assumes you either have or are making the maps necessary for actually understanding your data.
OK, first things first, you can take a thermochronologic sample anywhere there are rocks, but when you plan your sampling, there are some important things to consider.
First, although you can get important information from single samples, the most powerful sampling method involves collecting multiple samples from different structural positions. If cooling and exhumation have been vertical (as is the case with my current project, see this for a more in depth discussion), then this means collecting samples at different elevations. For reasons I'll explain in a later post, it helps to cover as much structural relief as possible without moving too much laterally. The ideal sampling surface in a region with vertical exhumation would be a sheer cliff. In regions like the basin and range, where faults and structures have rotated lithologic units, structural relief might be almost horizontal (like Yerington). Again, this is why you need to already understand your field area.
So lets just say that exhumation has been vertical. Your sampling transect will try to cover the greatest amount of relief possible.
In almost every case, the best lithologies to sample for thermochronology are granites or granodiorites. So to summarize, you are looking for a big granite mountain.
Unless you are attempting some rather specialized analyses, you also want fresh and underformed rocks to sample. Obviously then, avoid altered rocks, weathering varnishes, and rocks that have been faulted or otherwise chewed on. You will also want to avoid the outer few cm's of outcrop because of potential problems caused by forest fires (see Mitchell and Reiners, 2003, Geology v.31, n.12, pp.1025-1028; summary if you don't have access, fires can reset apatites, so don't sample the outer few cm's. They do very interesting things with the data, but I won't go into that right now).
OK, so find your enormous granite mountain made entirely of fresh outcrop (this sounds pipe dreamy, but actually describes some of my current field areas).
So you want to take a whole slew of samples from different elevations. It is pretty standard to sample every 100 meters or so of relief (structural relief or elevation). So, first step, find a place at the right elevation that has fresh outcrop. As below

If the rocks aren't that well exposed or fresh, it helps to spend some quality time with your chisel. I love the ones with the hand guards. If you are sampling granitoids, bring a sledge hammer, not a pick hammer. Sledge hammers (3 or 4 lb head, metal or wood handle) make the job much easier.
 check out Dr. New Helvetia chiseling away at an oriented sample

If you are interested in mica, hornblende, or K-Feldspar, you usually don't need much sample at all. You can often see the minerals you want to analyze with your hand lens, and can sometimes "field dress" your sample, and take out what you want with your knife (works well especially for books of mica). For apatite, zircon, and monazite, you have a lot more work ahead of you. since the first step in that mineral separation might mean feeding your sample through a jaw crusher, I find it useful to break your sample into bite sized chunks on the outcrop. If you wait to bash up a large sample into smaller pieces back in the lab, you have to spend all kinds of time cleaning up. You don't have to clean up or worry about contamination if you bash things up on the outcrop. Bashing things up also lets you remove the weathered rinds you want to avoid.
Many rocks seem to be either feast or famine when it comes to apatite and zircon abundance. Some rocks I've worked on yield piles and piles of apatite, where I could have gotten away with much less sample. Others yield nothing, and it wouldn't have mattered if I would have brought home a barrel's worth. I usually go for about 3-4 kgs of sample.

So you've now got your mandarin orange sized chunks of amazingly fresh granite, time to bag them. I prefer heavy cloth bags, like those available here at Miners Inc. I don't reuse them, so I label the bajeesus out of the bags with a Sharpie.

I write the sample name, elevation, and some basic info about the geologic context of the sample. I also like to take a picture of the sample bag (with the sample name readable) on the outcrop, kind of a way to help me remember the sample and where I took it. I also take a GPS reading, and plot myself manually on a topographic map. I'll actually check my map location against the GPS whenever possible.
 This is also a good way to trick otherwise camera shy members of a field party to have their picture taken. Again, Dr. New Helvetia.
 Taking pictures like this also helps me keep my photos organized. For example, I'll have pictures like this below, that I don't write a ton about in my field book (because I am an idiot who is still acquiring skills), but I have it sandwiched in between pictures I have GPS coordinates for, so I'm all good. I was able to recreate the outcrop where I saw these enormous K-feldspars, even though it was towards the end of the day and my field notes weren't as complete as they should have been.
The K-feldspars remind me of salmon swinning upstream.
 Now, I usually have a back-and-forth sampling route. Meaning, I'll hike up to the highest point in my field area, take a sample, and then head down, sampling as I go. This saves you from having to carry rocks up hill, which is usually a good thing. I also find it easy to plan time this way. I plan on eating lunch at the highest point, and I know that I can cover ~1300 m of elevation in a day (13 samples) with a good field party (at least 1 other person). You can also note good outcrops on your way up, making the way down more efficient.
Thursday, May 01, 2008
FT2008 Early Registration Deadline

The early registration deadline for the 11th International Conference on Thermochronometry is tomorrow! Get the purchase card and sign up now, otherwise your grant will have to pony up another 50$. All the information you'll need can be found here. The meeting is in Anchorage, from September 15-19. I've never been to this conference, but reliable sources tell me they have been excellent in the past.
The FT conferences started out as Fission-Track workshops, but have expanded to include all low-temperature thermochronometers. There will be a wide range of posters and talks at the conference. The conveners are specifically requesting papers that fall into these categories:
1) New analytical developments in helium dating and fission-track analysis
2) Thermochronology of orogenic belts
3) Detrital thermochronology, provenance, and basin analysis
4) Thermochronology of sedimentary basins
5) Kinetics and thermal modeling
6) The thermotectonic framework of Alaska and adjacent areas.
Abstract and final registration deadline is June 13th, still time to crank out some ages!
Incidentally, speaking of abstracts, when writing them I always like to paraphrase our former Secretary of Defense and say "You write abstracts with the data you have, not the data you want."
Tuesday, April 29, 2008
Spring [Field Trip] Fever
Here at ESRU we've been enjoying some unseasonably warm weather, even hitting the 80's last week. Although the cold nights have returned, this amuse-bouche of spring has sent my brain into desert field trip mode.
As a undergraduate, my first extended field trip was to the Colorado Plateau. The trip was at the end of my freshman year, we left TMLAC in early May, and spent the next two weeks all over the Plateau. As you might imagine this was a watershed moment in my professional life, although my geoscience experience at the time was limited to one introductory course, but by halfway through the trip (camping in the snow on the north rim of the Grand Canyon), I knew I was going to be a geologist. I've returned to the Colorado Plateau a few more times, including a family trip (my graduate present from my parents), and my honeymoon (belated, but incredible).
In graduate school I either TA'd or hung out on a Death Valley/Owens Valley/White Mountains spring field trip many times. Depending on the course and professor this trip would change specifics, but at its base always involved a week in the desert. The timing of this trip is really perfect. It was usually smack dab between two academic quarters, a time when you were definitely ready for a break. More importantly, the weather this time of year is amazing. If you are lucky, your trip will coincide with the brief but colorful bursts of wildflowers. The high elevations are still cool (cold even, you can find snow fields once you get over a few thousand feet), and the low elevations are not yet absurdly hot. Most of the campsites cool off enough at night to allow for comfortable sleeping, but once the sun rises you can get away with shorts and Tevas. Plus, you beat most of the crowds. Win-win-win.
The desert is one of the things I've missed most since moving out here. In truth the region around ESRU is beautiful and scenic, especially this time of year, don't get me wrong. But it is not the same. Thoughts of these trips have inspired me to post some of my random pictures from the deserts, a sort of virtual field trip.
To fully put myself into the desert, I suppose I could wake up early, make coffee, and fry a bagel in butter (seriously, try this, fry the cut side of the bagel, then add cheese and guacamole, and make into a sandwich.....most amazing breakfast ever.)
So the pics

The end of Monarch Canyon in the Funeral Mountains, looking west into Death Valley.

Racetrack playa, Death Valley National Park

Mono Craters, Owens Valley California

Wildflower preserve east of Arvin, CA, California Golden Poppies in the foreground

Picture taken by moonlight (long exposure) in Arches National Park. Thanks to my brother for suggesting the technique.

Standard issue picture of Delicate Arch, Arches National Park

View looking into Death Valley

Ripples in sand dunes in Death Valley

The Boundary Canyon Detachment Fault, Funeral Mountains, Death Valley National Park. View is looking north, fault is at a low angle (it has actually been overturned) right at the break in color.
Saturday, April 26, 2008
Great Gift Idea for that Geochronologist in Your Life
I just wanted to mirror a post on the Arizona Geology Blog in case you know any geochronologists with upcoming birthdays, or wanted to get a head start on the Holiday shopping season. This could be the very first gift item aimed directly at us "something"chronologists. And, seeing that this is the world's greatest thermochronology blog, I figured it was appropriate for me to point you here, where you can learn all about the PaleoClock!
Sunday, April 20, 2008
Farallon Plate Part 2
Next in my hall o' fame of geoscience images is the Farallon Plate - North American Plate animtion put together by Tanya Atwater (UCSB). This is one of a series of excellent earth science animations available at this site. This cartoon continues last week's theme, the fate of the Farallon plate, and follows (in map view) the evolution of the western U.S. plate boundary from 38 Million years ago until present. I have long considered this to be one of the best and most useful geoscience illustrations ever produced.
I've seen this animation in a wide variety of talks and lectures. As someone who went to graduate school in California, every discussion of the San Andreas fault would begin with this movie. But I've also seen it used when discussing general plate tectonics, basin and range extension, or this history of magmatism in California.
The movie was made primarily using plate reconstructions. Basically you "unspread" the oceans, using the time and velocity constraints provided by sea-floor spreading anomalies to step things back in time. This is augmented and checked using terrestrial records of deformation. Although it is slightly simplified, it is a fantastic view of the development and evolution of the western U.S., especially California, and the development of the San Andreas Fault.
In the movie you will see a number of things. First off, the thick red lines are the plate boundaries. Separating the Pacific Plate from the Farallon Plate is a divergent plate boundary, where sea floor spreading is making new oceanic crust. The toothed red line separating the Farallon Plate from the North American Plate indicates a subduction plate boundary, where the Farallon Plate is being subducted underneath North America. This plate configuration begins at roughly the same time as the Humphreys figure I blogged about here. The big white arrows are plate velocity vectors relative to a stable north america. The thin black lines on North America are rough outlines of the state boundaries, prior to Basin and Range extension.
So at the beginning of the movie, the western plate boundary of North America is a subduction zone. Beginning in southern California (at about the latitude of Santa Barbara) at ~30 Ma, the divergent plate boundary (or spreading ridge) separating the Pacific and Farallon Plates is subducted. This results in in the formation of a strike slip boundary, the margin we now refer to as the San Andreas Fault.
As more of the spreading ridge is subducted, the transform San Andreas fault gets longer and longer. You also see the initiation of significant extension throughout western North America. These regions are colored a salmon color in the movie. This extension roughly doubles the present width of the western U.S. This extension leads to the formation of the Basin and Range province.
As the San Andreas continues to form, you can watch parts of southern California rotate (the transverse ranges) and/or be translated northwards. Finally, the movie finishes with the modern plate set up.
As simple as the cartoon now looks, it represents a great deal of effort to put together. And, if you are looking to discuss any geologic event in the western U.S. in the past 40 Ma or so, this cartoon provides a fantastic framework.
I've used this movie every time I've TA'd or taught a course, or given lectures to audiences unfamiliar with Cordilleran geology. The figure has the rare ability to talk to all levels of earth scientists. People with no background can really see the development of a very complex plate margin.
Now a quick disclaimer. The website that hosts these movies says they can be used for free for educational purposes. My blog is non-profit and I consider it to be primarily an educational endeavor, which is why I am posting the video. If anyone connected to the video does not appreciate that, please just email me.
Enjoy! And check out the site I reference for a whole boatload of geoscience movies.
Monday, April 07, 2008
Eocene Farallon Lithospheric Chalupa
Also see my second post relating to the Farallon Plate here.
This past Friday I was talking with some of the people in my research group and we ended up discussing our favorite published figures. This is easy for me, hands down, it is the Eocene Farallon Lithospheric Chalupa of Humphreys (1995). I'll explain why I love this figure in a minute, but first...
I don't think I'd be out on a limb to say that when many geologists first look at a paper, they begin by studying the figures. Many branches of geology are very visual, the ultimate goal often being complete 4 dimensional reconstructions of complicated events. As such, most earth scientists spend a great deal of time learning how to make good figures. For many geologists, the steep part of this learning curve is field camp, when they first learn how to make geologic maps.
I think if you want to consider the information density of a figure, nothing can beat a geologic map. I am continually amazed at the amount of information that trained geologists can gather from geologic maps. The amount of information packed into a geologic map of course depends on the quality and scale of the map itself, but really good maps can detail billions of years of faulting, folding, erosion, magmatism, deposition, and metamorphism.
And one more "quick" aside. I think that my general reverence for geologic maps has played into my slight annoyance with Edward Tufte. This is probably entirely stupid and absurd on my part; I apologize in advance and fully accept criticism, but I am continually amazed that Tufte doesn't spend more time singing the praises of geologic maps. I had a chance to attend a public lecture by Tufte a few years ago. In general, I am a big fan of many of Tufte's ideas. I think that many people, geologists included, need to think seriously about how they visually represent their information. I think that geologists already have to spend a lot of time doing this, and so some of the examples seem kind of basic. I think this molehil of an annoyance of mine became a small end moraine of annoyance when I saw Tufte speak. First the background, this was a public lecture attended by about 600 people. Although Tufte is not categorically against things like PowerPoint or slides, he is much more in favor of archival quality paper. Unfortunately, these are expensive, and impractical for 600 people. So, the first 200 or so people who got into this lecture had beautiful large images to look at during the talk, images on such incredible paper that they are undoubtedly as bright and colorful today as they were 2 years ago. The rest of us got to crowd a dozen or so people around a single piece of paper, trying to follow along with his message. I would have loved a crappy PowerPoint slide complete with kitten background and lightning sound effects. I guess I am saying that I think it is important to strike a balance between quality and accessibility.
Long story short, I get a little bit stuck-up when it comes to geologists and visual representations of data. That is why I've decided to start blogging about some of my favorite figures.
So to start we have the Eocene Farallon Lithospheric Chalupa, published in 1995 in a paper by Eugene Humphreys (Geology, v. 23, n. 11, pp. 987-990). What this figure shows is his preferred model for the removal of the Eocene Farallon slab. The idea is that during the Laramide orogeny, the Farallon slab was subducting at a very shallow angle, effectively transferring plate boundary forces into the interior of the continent during the Laramide orogeny (making some of the Rocky Mountain structures). Beginning in the Eocene this slab was somehow removed, allowing hot asthenosphere to rise up and introduce a great deal of heat and basaltic magma into the western North American lithosphere. This led to the "ingimbrite flare-up," a period of intense volcanic activity in western North America, from Washington in the north down into northern Mexico. Volcanic activity did not begin everywhere at the same time, in fact it seems to have started at the northern and southern margins of the province in the Eocene. The volcanic front moved south from Washington, and north from Mexico, eventually meeting around Las Vegas in the Miocene (Vegas baby!) Many geologists interpret this to be the result of the gradual peeling away of the Farallon slab from both the north and south at roughly the same time.
So, here is the figure, the Eocene (~35 Ma) Farallon Slab!

So, with that background, what Humphreys attempts to explain in this paper is that pattern of magmatism, and how it could be related to slab removal. My favorite figure is his preferred model for Farallon slab removal. Why do I love this figure? Well.
- It make sense. It takes a while to wrap your head around, but it explains the removal of the slab, and the associated patterns of magmatism.
- The perspective. The view is looking up from the mantle somewhere underneath eastern Canada. The view is looking to the west, with the subducting Farallon slab coming right at you. I am used to map view and cross-sectional views, but I love the moxy to use this perspective. I wish google earth had this view.
- The approximation. I like the fact that this is simplified and hand made. I don't think Illustrator has a feature that makes buckled subducting slabs. In my geologic education I have definitely felt pressure to make diagrams crisp and Illustrator-ific. I can imagine this figure originated on a sketchpad or (if I were to write this as a legend) cocktail napkin, and didn't get caught up in the refinement process.
- It reminds me of a chalupa. Not that I consider Taco Bell excellent cuisine, but the buckled Farallon slab is a dead ringer for an enormous chalupa. And, it should be noted, that downing chalupas can also lead to flare-up events. I love mexican food, and Taco Bell is a distant cousin of mexican food, so that makes me smile.
- I think my favorite thing though, is the fact that I didn't buy this figure at first. I first saw it in a seminar on Cordilleran geology when I was in graduate school. I remember spending a great deal of time trying to figure out what it was representing, and why this was the preferred model. At first I thought it was absurd and overly complicated. I am not an expert on slab removal or the ingimbrite flare-up, but I am now pro-Farallon Chalupa. Every time this figure comes up people who've never seen it are always unsure. Geology can be complicated. Geologic maps are complicated if you aren't used to looking at them. So I like that this image makes brains work. I don't think anyone immediately accepts this diagram, which is good. It is immediately interactive.

So what are your favorite figures? Any nominations? Feel free to nominate yourself if you have a figure you are particularly proud of.
Subscribe to:
Posts (Atom)

